Here’s something to chew over for the weekend – let’s take the most detailed ABS Labour Force statistics available by geographic region from June 2009 and break that data down into three categories.
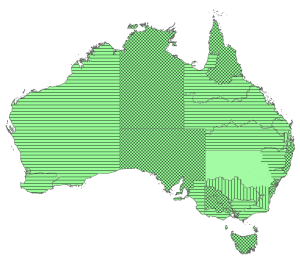
1. Where the derived unemployment rate has actually reduced since the last election (yes, as surprising as it might sound, such places do exist!). We’ll represent these regions with a cross-hatch.
2. Where the unemployment rate has increased by between zero and 3% since the last election. We’ll represent these areas with vertical horizontal lines (Ha! Sorry about that…)
3. Where the unemployment rate has increased by more than 3% since the last election. We’ll represent these areas as vertical lines.
When we map these regions in a hideous pale green colour, this is what we get: (click to expand all these maps)
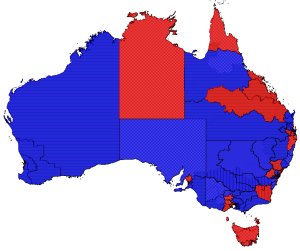
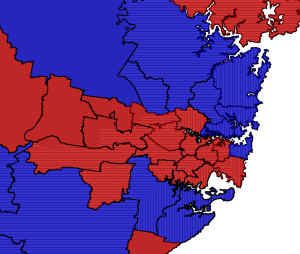
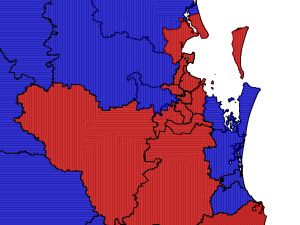
Now let’s go a step further. Let’s overlay these cross-hatched, vertical and horizontal lines (representing the changes in the level of the unemployment rate) onto the 2007 Federal Electorates. It would be nice to use the redistributions, but they’re not finalised yet, so we’ll use the old boundaries. We’ll also color them red for Labor held, and blue for non-labor held.
But wait, there’s more!
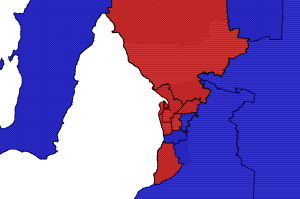
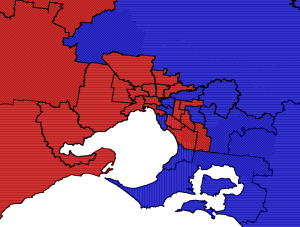
Let’s zoom into the major population centres and take a closer look at the seats – except for Perth because all the seats there have had an increase in the unemployment rate of between zero and 3%, so there isnt exactly much to see.
To help those folks who can’t identify all these electorates by shape (and shame on you, psephy lightweights! 😀 ), the AEC has a helpful pdf map to assist over here (3.5MB):
https://aec.gov.au/pdf/elections/2007/hor_resultsmap.pdf
First up, we’ll do Adelaide and Melbourne, then Sydney and Brisbane below them – note, with Brisbane, the cross-hatched area at the very bottom is actually where NSW starts.
You’ll notice that some seats contain different rates of change in the unemployment rate -that’s simply a result of the electoral boundaries not matching up with the statistical regions the ABS uses.
In western NSW there’s a few blank regions – that’s due to the data being too unreliable there as a result of sample sizes being too small.
If unemployment is going to be an issue at the next election, this is about as close as we can get to seeing how changes in the unemployment rate since the last election might be affecting politics on a seat by seat basis.
UPDATE:
I’ve updated these maps with proper labels and a better layout in a new post.



Crikey is committed to hosting lively discussions. Help us keep the conversation useful, interesting and welcoming. We aim to publish comments quickly in the interest of promoting robust conversation, but we’re a small team and we deploy filters to protect against legal risk. Occasionally your comment may be held up while we review, but we’re working as fast as we can to keep the conversation rolling.
The Crikey comment section is members-only content. Please subscribe to leave a comment.
The Crikey comment section is members-only content. Please login to leave a comment.