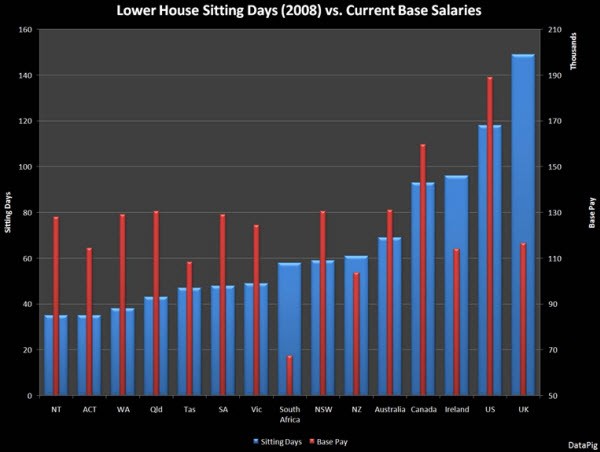
Just in case Malcolm Turbull is wondering whether the grass is greener elsewhere, I’ve compiled a handy reckoner of effort versus reward for politicians.
This chart compares the number of parliamentary sitting days for each lower house (House of Reps in Australia, House of Commons in the UK, etc) with the current base salary for a member of that house.
The UK, Irish, NZ and South African parliaments are clearly to be avoided, but how about the US or West Australia (well any Australian State except Tasmania, really)?
Sitting Day data is sourced from Horne, N, Parliamentary sitting days and hours 2008, Parliamentary Library, 19 November 2009.
Salary data is compiled from a survey of the various parliamentary websites and Parliamentary allowances, salaries of office and entitlements, Parliamentary Library, 1 October 2009.


Crikey is committed to hosting lively discussions. Help us keep the conversation useful, interesting and welcoming. We aim to publish comments quickly in the interest of promoting robust conversation, but we’re a small team and we deploy filters to protect against legal risk. Occasionally your comment may be held up while we review, but we’re working as fast as we can to keep the conversation rolling.
The Crikey comment section is members-only content. Please subscribe to leave a comment.
The Crikey comment section is members-only content. Please login to leave a comment.