This week’s Essential Report has the primaries running 45 (down 1) / 38 (up 3) to Labor, washing out into a two party preferred of 56/44 the same way – a 1 point gain to the Coalition. The Greens come in on 8 (steady) while the broad Others are on 9 (up 1). This comes from a two poll rolling sample of 1915 (meaning it splits the Christmas period), giving us an MoE that maxes out around the 2.2% mark.
Essential this week focused on political approval ratings, economic and employment expectations as well as a question on perceptions of Australia day that doesn’t involve lamb. These additional questions came from a sample of 1101, giving us an MoE that maxes out around the 3.0% mark.
.
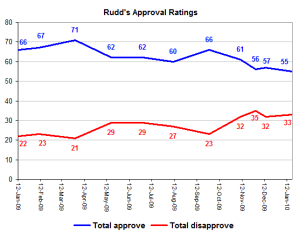
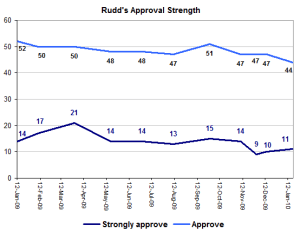
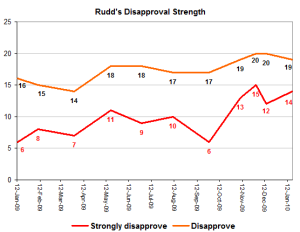
Do you strongly approve, approve, disapprove or strongly disapprove of the job Kevin Rudd is doing as Prime Minister?
On the cross tabs we have:
Perception of the job Kevin Rudd is doing as Prime Minister followed party lines – Labor voters were more likely to approve of the job he is doing (91%), while Coalition voters were more likely to disapprove (74%). 20% of Coalition voters and 73% of Green voters approve of the job Rudd is doing as Prime Minister.
We’re seeing the same reductions in Rudd’s approval levels with Essential that we are seeing with the Newspoll satisfactions. The more than doubling of the number of people that “Strongly Disapprove” of Rudd is an interesting little phenomenon too.
.
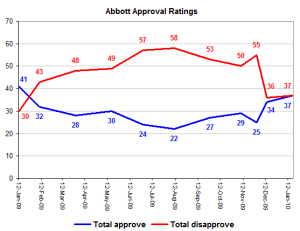
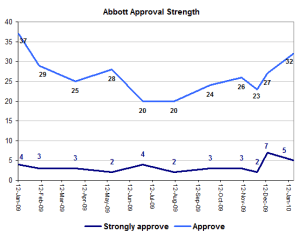
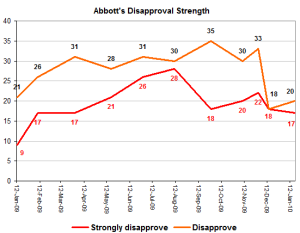
Do you strongly approve, approve, disapprove or strongly disapprove of the job Tony Abbott is doing as Opposition Leader?
On the cross-tabs we have:
Perception of the job Abbott is doing as Leader of the Opposition followed party lines – Coalition voters were more likely to approve (70%), while Labor voters were more likely to disapprove (50%), as were Green voters (70%). 26% of Labor voters approve of the job Abbott is doing as Opposition Leader.
Two things worth mentioning here: Firstly, only the two most recent observations in the charts belong to Abbott. Secondly, Abbott’s approval growth over Turnbull’s last figures is coming more from generic approval than from “strong” approval. That’s interesting in terms of the argument that Abbott is a “consolidate the base” politician, because while he may well be doing that, it doesn’t seem to have any “Cult of Tone” reaction behind it.
.
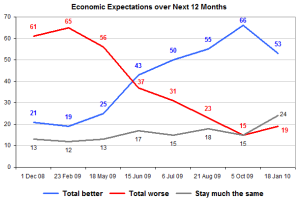
Over the next 12 months do you think economic conditions in Australia will get better, get worse or stay much the same?
On the cross-tabs we had:
Males were more likely than females to think economic conditions will get better over the next 12 months (59% v 47%).
Labor voters were more likely than Coalition voters to think conditions will get better (65% v 47%). Coalition voters were more likely to think conditions will get worse (28%).
People aged 18 – 24 were more likely than those aged 55 years and over to think that economic conditions will improve over the next 12 months (61% v 52%).
I don’t know about you folks, but I find that chart rather amazing considering what is happening elsewhere around the world.
.
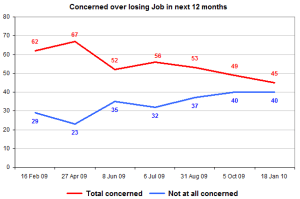
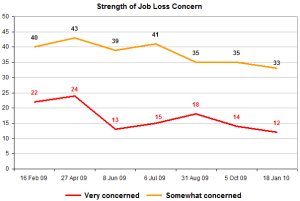
How concerned are you that you or some member of your immediate family will lose their job in the next year or so: very concerned, somewhat concerned, or not at all concerned?
On the cross-tabs, Essential tells us:
Females were more likely than males to be very/somewhat concerned over job loss (47% v 41%).
People in part-time work were more likely than those in full-time work to be concerned over job loss (55% v 45%).
Coalition voters were more likely than Labor voters to be very/somewhat concerned (52% v 43%).
.
Tuesday 26th January is Australia Day. Will you personally be doing anything to celebrate Australia Day or do you treat it as just a public holiday?
On the cross-tabs, we have:
Females were more likely to indicate they will be doing something to celebrate Australia Day (43%) while males were more likely to think it is just a public holiday (43%).
18 – 24 year olds were more likely than those in other age groups to be doing something to celebrate Australia Day (44%).



Crikey is committed to hosting lively discussions. Help us keep the conversation useful, interesting and welcoming. We aim to publish comments quickly in the interest of promoting robust conversation, but we’re a small team and we deploy filters to protect against legal risk. Occasionally your comment may be held up while we review, but we’re working as fast as we can to keep the conversation rolling.
The Crikey comment section is members-only content. Please subscribe to leave a comment.
The Crikey comment section is members-only content. Please login to leave a comment.