Continuing on from Part 1 where we had a look at the vote estimates and win expectations, we now move on to the additional questions that were asked on greater federal government involvement in the hospital system and a question on which party is best to handle a number of issues.
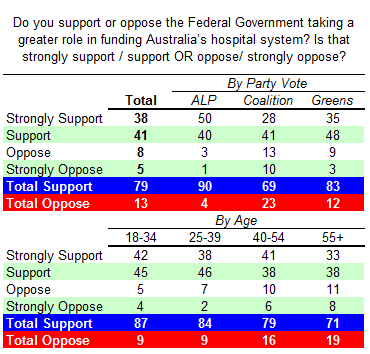
The hospital question and its results – including cross-tabs – came in like this:
The results here could become a little problematic for the Coalition when it comes to them adopting a political position on Rudd’s health plan. With large, almost super majorities, supporting greater Federal involvement in funding the nation’s hospital system, any opposition to the plan will have to walk the tightrope between arguing that, yes, the Coalition wants greater Fed involvement too – but just not Rudd’s particular flavour of Federal involvement.
Lines like “they can’t manage insulation, how can they manage health” are effectively an argument against greater Federal funding – especially without any alternative Coalition funding plan – carrying with it what looks like a pretty significant political risk.
What’s interesting here is not only the broad bipartisan support for greater Federal funding, but also the large size of the “strongly support” responses across all demographics. Greater federal funding of the hospital system seems to something held with a large dose of conviction.
Next up, Nielsen asked the following question:
I am going to read out a number of issues. For each one please tell me which of the major parties, the Labor Party or the Liberal-National Coalition, you think would best handle that issue.
Which of the major parties, the Labor Party or the Liberal-National Coalition, do you think would be best for handling…
The issues were rotated in their asking order. At this stage, it might be worth revisiting some analysis we did on the dynamics of these sorts of “better party to handle” questions since we have to be careful not to read too much into them.
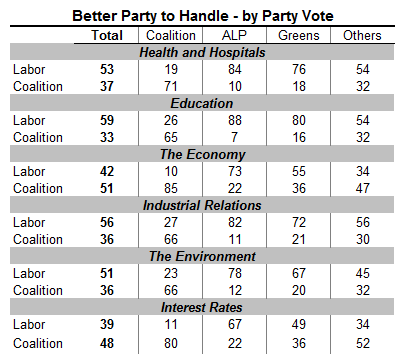
So saying, with the results of this poll, we’ll look at the total headline figure, then the results by party vote:
For instance, with Health and Hospitals, 53% of the population believe Labor is the better party to handle the issue while 37% believe the Coalition is the better party to handle the issue. 19% of Coalition voters believe that the ALP is the better party to manage health and hospitals while 10% of Labor voters believe that the Coalition is the best party to handle this issue. Greens voters split 76/18 towards the ALP on the issue while the broad “Others” split 54/32 to Labor on the issue.
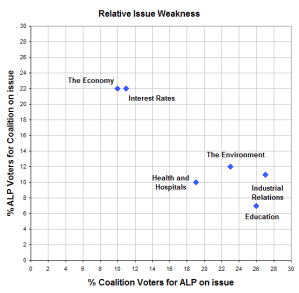
Another thing that we can do is chart – for each issue – the proportion of major party voters that believe the other major party, the party they don’t vote for, is best party to manage each issue. It might tell us something about the relative weakness each party has on any given issue.(click to expand)
Education and Industrial Relations are the two issues with the largest numbers of Coalition voters believing that Labor is the better party to manage, while the Economy and Interest Rates are Labor’s relatively weakest issues, having the largest numbers of Labor voters believing the Coalition is the best to manage.
Like all these better party to handle questions, I suppose, does it actually matter? If we had an election campaign with a focus on industrial relations and education, would this be more likely to help the ALP gain swinging Coalition voters than, say, a campaign with a heavy focus on the economy and interest rates? Interested in your thoughts as I’m dubious about what this sort of “better party to manage” data can actually tell us without getting down to respondent level data.
Finally, there’s something worth looking at with the net approval ratings. Since October, every pollster has picked up on Rudd’s approval ratings having steadily declined. Similarly, Abbott has lifted the approval ratings for the Opposition leader over the last few months – but what is interesting is looking at the age breakdowns on the approval ratings themselves, particularly the net approval ratings. Nielsen didn’t run a poll in December, they ran two in November – one in the first week and another in the final week of that month. The other thing worth mentioning is that all states have pretty much moved together – so the disparity in demographic movements on net approvals has really only happened in the age-breakdowns.
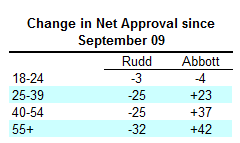
One of these things is not like the others – as they say. The 18-24 year demographic has barely changed their net approval ratings for either Rudd or the Opposition Leader over the last 6 months, bucking a trend that we see in every other age block. In fact, if we look at the change in net approvals over this period:
We find that the older voters are, not only are they more likely to have given Rudd declining approval ratings, but are also more likely to have given Abbott greater approval ratings.
Abbott is getting strongest results with the 55+, then declining down in strength until the youngest demographic, where Abbott hasn’t moved them at all. Similarly with Rudd, his weakest result is among the 55+, getting less weak results through the age groups until the 18-24’s, where his approval ratings are about the same where they were back in September.
The 18-24’s seem to be completely locked up for Rudd and locked out for Abbott. It’s pretty unusual that you get such large disparities like this in approval rating changes across time.


Crikey is committed to hosting lively discussions. Help us keep the conversation useful, interesting and welcoming. We aim to publish comments quickly in the interest of promoting robust conversation, but we’re a small team and we deploy filters to protect against legal risk. Occasionally your comment may be held up while we review, but we’re working as fast as we can to keep the conversation rolling.
The Crikey comment section is members-only content. Please subscribe to leave a comment.
The Crikey comment section is members-only content. Please login to leave a comment.