The Brylcreem’s to blame. Perhaps we should start calling it the alleged Labor Party now that Kevin Rudd has made it so clear that he is an absolute believer in the saying that while the first duty of a politician is to get elected, the second duty is definitely to get re-elected. Nothing else but getting back into the Lodge seems to matter as policies are daily discarded.

The first real villain of the art of spin exposed!
Where it all ends, this politics without principles, I know not but I do reckon I know where it started. It’s all the fault of the Gough Whitlam aide who, in the late 1960s, told the leader to stop putting Brylcreem on his hair. Get rid of that slicked down look if you ever want to be a winner was the advice after the defeat by John Gorton. Get with it. Fluff the hair up a bit. And so the dominance of style over substance in the Labor Party began.

With help from the Peek Freans
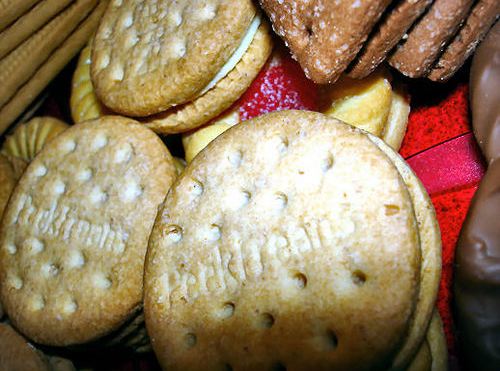
Helped along, I was reminded this week by a former Whitlam staffer, who has now joined the ranks of those disenchanted with the shape of the Rudd-led party, by the Peek Freans — the shorthand description by the Whitlam female staffers for the influx of bright young men from Foreign Affairs who started gathering around the Labor jobs honeypot from the time it looked like Labor would finally end 23 years of coalition rule. Peek Freans because they were all the same with only the colour of the filling being different.
And now it has come to this. A Peek Frean has triumphed and holds the top political job in the nation.
An appropriate time for reflection. And now that saving the planet from rising temperatures has been sacrificed to the cause of re-election it is perhaps a good time to consider the latest bit of evidence of a warming planet produced by the United States Environmental Protection Agency called Climate Change Indicators in the United States.
The EPA gives a host of examples of what is happening to the world and why this is not a time to be turning away from doing something about it and here are a couple of examples.

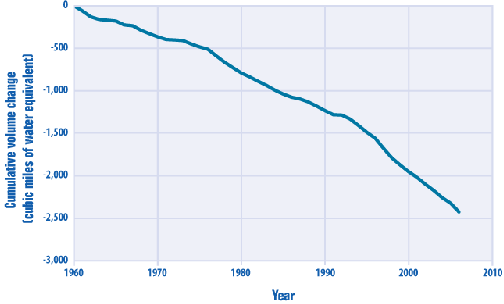
Change in Volume of Glaciers Worldwide, 1960–2006.
This figure shows the cumulative change in volume of glaciers worldwide beginning in 1960. Negative values in later years indicate a net loss of ice and snow compared with the base year of 1960. For consistency, measurements are in cubic miles of water equivalent, which means the total amount of ice or snow lost has been converted to the equivalent volume of liquid water.

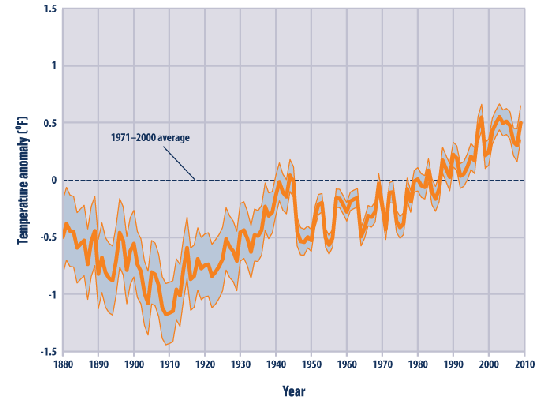
Average Global Sea Surface Temperature, 1880–2009.
This graph shows how the average surface temperature of the world’s oceans has changed since 1880. This graph uses the 1971 to 2000 average as a baseline for depicting change. Choosing a different baseline period would not change the shape of the trend. The shaded band shows the likely range of values, based on the number of measurements collected and the precision of the methods used.
Don’t abolish the department. A Department of Climate Change when nothing is to be done about climate change is an obvious target for criticism but surely the better course than abolition is to put the staff to work not on stopping global warming (something Australia is helpless to do on its own) but working out the best way that Australia will be able to live with it.
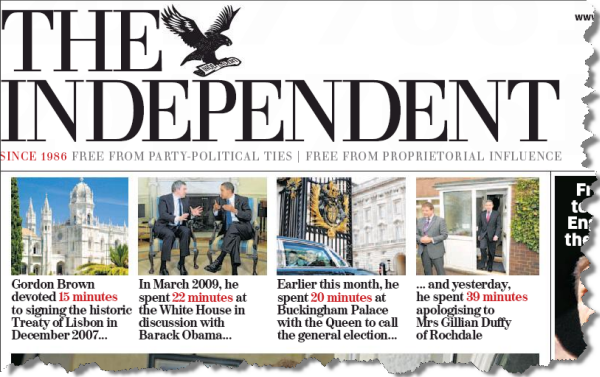
Send for Plunkett. That the political advance man who sorts out the daily stunts before the politician arrives should now be very obvious to UK Labour leader Gordon Brown. He got himself into a fine old mess yesterday when the lovely old lady who was meant to provide one of those heart-warming media moments didn’t say the right things. The Prime Minister did the best he could but when he thought he was in the safety of his official vehicle he rounded on the staff for messing things up. Which has led to headlines throughout Britain, such as this in The Independent:

What Brown clearly needs is to borrow Mark Plunkett, now a Brisbane barrister, who in 1980 became Australian Labor’s first advance man and who, I am sure, is still the best. I remember him with fondness for saving me from embarrassment on many occasions by changing the stunts I had nutted out for Bill Hayden into more appropriate pictorial events and for a while back then it even looked like those early attempts at spinning might have been successful. I mean, how could I forget how we tried to make it look like Bill was actually interested in sport so we sent him to have a look at the QEII Stadium only to find that it was hosting a school sports carnival, which saw our man mobbed like he was a rock star. Some people were unkind enough to say it was all an accident but if it was it is the kind of luck that Gordon Brown’s advance person clearly does not have.


I have to say what a completely useless graph Richard has dished up regarding reductions in gleciation since 1960. Gosh! The steep slope of the graph is positively scary, Richard, but how many cubic miles are there in total? 6000? well, they’re nearly half gone then. 6 million? well the change is a minor fluctuation.
This is a classic example of the climate change lobby showing total disregard for the intelligence of its audience. It’s a PR campaign, not a sharing of meaningful information. Why are you surprised the public is not paying attention any more?
David,
From http://www.waterencyclopedia.com we find that that the total volume of the glaciers AND ice caps (not ice sheets) is 180 000 cubic miles. It follows then that total volume has decreased by around 1.4% over the last 40 years. Combined with the observed retreat of the glacier outlets we are pretty sure that this isn’t a “minor fluctuation”.
Richard supplied you with the link to the website with more comprehensive information. Did you follow that link? Richard mentioned *two* EXAMPLES of the information contained at the EPA’s site. But what do you carp on about? Not sharing of meaningful information. Would you have been satisfied if he had specifically mentioned every single diagram contained at the EPA site?
We are not surprised the public isn’t paying attention anymore. There has been a very well funded campaign to spread doubt and misinformation about climate change. Clearly your “intelligence” hasn’t stopped your from being taken for a fool.
GregB,
Your info that it represents a 1.4% fall is significant and makes the story meaningful but it never made it into the story. Though I know I can dig for it, the journalist has a responsibility not to present data like and informercial and that’s what this is.
It’s just a useless graph, Greg, stuck up there to slap us in the face.