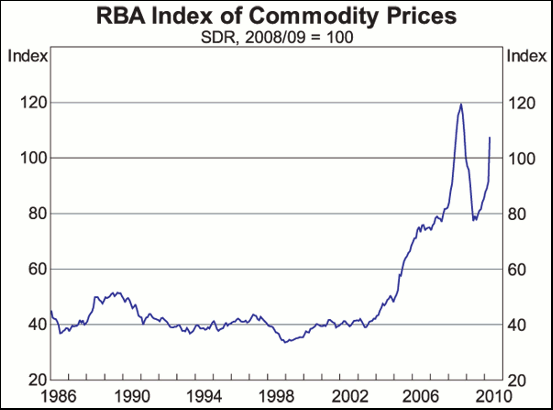
This graph from the Reserve Bank is why interesting rates are rising (and will almost certainly be bumped up later today) and its why the federal government wants to introduce a so-called super resource rent tax.
The graph is the Commodity Price Index that the RBA publishes monthly, April’s rise (preliminary) was spectacular, the biggest monthly rise ever recorded and larger than any thing in resource booms since 1982, when the index started.
It clearly shows the acceleration in commodity prices for Australian exports is driving something unheard of, the second surge in our terms of trade and national income from the China boom in three years.
The graph well illustrates the cliched double-edged sword: great for the country, jobs and hungry governments, bad in that it is pumping in so much money that interest rates are rising and will have to go on rising to try and control the expansionary and inflationary impact of this flood of income.
It’s what happened in 2008 as the RBA lifted interest rates up to the implosion of Lehman Brothers in September of that year. Inflation peaked about 5% in that year, the cash rate at 7.5%. Today the cash rate will almost certainly go to 4.5% and judging by the graph, go even higher in coming months.
The government argues that too little of the rising export receipts from iron ore, coal, gas, copper, etc, goes to Australia and Australians: BHP Billiton is 40% owned offshore, Rio Tinto 70% (and is a foreign company anyway).
The rise in revenue for the miners is now starting to grow quickly and the central bank said yesterday that the index rose 17.6% in SDR terms (that’s a basket of four currencies) and 15.1% in Australian dollar terms last month.
They were the biggest rises yet recorded in the index since it started in July 1982, even larger than the rises in the first China boom in 2007.
The RBA emphasised these are preliminary figures only:
“The increases in the estimated prices for iron ore and coal in April reflect partial adjustment to substantially higher contract and spot prices.
“For example, coking coal contract prices have increased by 55%-100% in the June quarter relative to 2009-10 contract prices, while June quarter iron ore fines prices are estimated to have settled around 100% higher. Annual thermal coal contract prices have risen by 36%-40%.
“The estimates for April are preliminary because actual export data provided by the Australian Bureau of Statistics are not yet available.
“In previous years, changes to bulk commodity contract prices have passed through to export prices and the index over a number of months, and this is also expected to occur this year.
“Some adjustment in iron ore and coal export prices had already taken place prior to April, in part reflecting spot‑market sales.
“Further rises are expected over the subsequent months. Because of the changing structure of the contract pricing system, the index will likely be subject to more revisions from April onwards than in the past.”
In SDR terms, commodity last month were still 10% below their previous peak in September 2008, but were more than 39% higher than the most recent low point in May of last year.


Crikey is committed to hosting lively discussions. Help us keep the conversation useful, interesting and welcoming. We aim to publish comments quickly in the interest of promoting robust conversation, but we’re a small team and we deploy filters to protect against legal risk. Occasionally your comment may be held up while we review, but we’re working as fast as we can to keep the conversation rolling.
The Crikey comment section is members-only content. Please subscribe to leave a comment.
The Crikey comment section is members-only content. Please login to leave a comment.