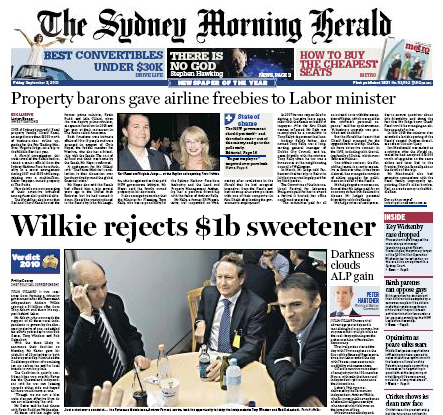
How Australia is governed: two pictures tell the story. Two pictures on page one of the Sydney Morning Herald this morning show us a lot about the way Australia is governed.

Up at the top we have Sydney property developer Karl Kazal pictured smiling alongside an equally cheerful NSW Minister for Fair Trading Virginia Judge. The surrounding story gives us some details of how the Kazal family helped pay for the Minister travelling to a junket in Lebanon and for some dealings with the NSW Government about property matters. All very chummy with Federal Labor MP Chris Hayes getting an honourable mention as a Kazal family friend as well for having Julia Gillard at a little function where the Kazal’s picked up the tab.
Then we move down Granny’s page one to the nation’s richest man Andrew Forrest sitting down with two of the three independents who will determine who becomes the Federal Government. Another chummy little meeting.
Welcome to fiscal space and good news for Australia. Fiscal space. It’s the latest addition to my vocabulary from the wonderful world of international economics courtesy of the International Monetary Fund.
Sometimes, says an IMF report out this week, “fiscal space” is used to refer to the scope for financing a country’s deficit tout court or for financing the deficit without either a sharp increase in funding costs or undue crowding out of private investment. For this IMF analysis the authors have used what they call “a simpler, starker definition — namely, fiscal space is the difference between the current level of public debt and the debt limit implied by the country’s historical record of fiscal adjustment.”
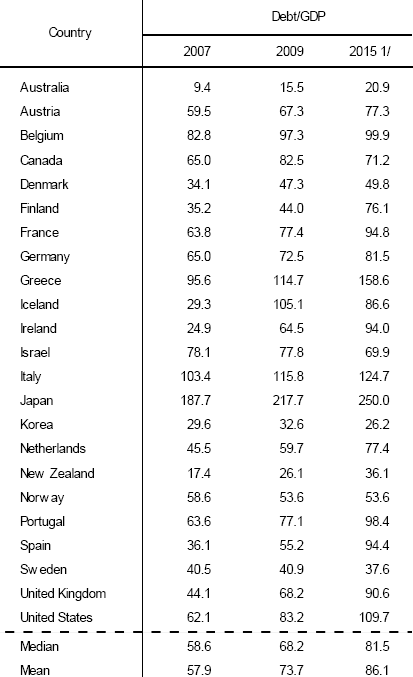
By that measure Australia is doing quite nicely thank you whatever the would-be Treasurer Joe Hockey has been telling us in recent months. Australia clearly has one of the most manageable public debts in the world with the sobering evolution of public debt in advanced economies since the crisis, as well as IMF projections for debt ratios over the next five years shown in the following table:
Government Debt to Gross Domestic Product.

Among the advanced economies, Australia, Denmark, Korea, New Zealand, and Norway generally have the most fiscal space to deal with unexpected shocks — although of course they, too, must be mindful of future fiscal pressures cautions the IMF report.
Greece, Italy, Japan, and Portugal appear to have the least fiscal space (i.e., least scope for increasing public debt without a fundamental shift in the behavior of the primary balance), with Iceland, Ireland, Spain, the United Kingdom, and the United States also constrained in their degree of fiscal maneuver, the more so owing to the run-up in public debt projected in coming years as well as demographic pressures and the possible realization of contingent liabilities.
Who knows how they’ll jump. And then there were three and I have no idea at all how they will decide. All I can see is that what might just have an influence on them, if ethical and good governance actually is to be the important factor that the trio from the country claim, is the revelation that Tony Abbott was prepared to find $1 billion to pay for a new Hobart Hospital.
The market seems to think so anyway. From having the Coalition the favourite at lunchtime yesterday the Crikey Election Indicator by 5pm last night had swung very much Labor’s way — Labor a 72% chance to the Coalition’s 28%. The punters are not so certain this morning with Labor back a little to being a supposed 65% chance.
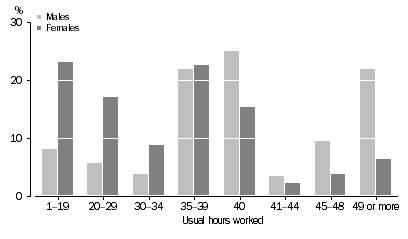
How long we work. I’m not sure about working harder but men certainly work longer. The Australian Bureau of Statistics reported this morning that of the 10.9 million people aged 15 years and over who were working at February 2010, there were proportionally more women who worked less than 35 hours per week (49% of women compared to 18% of men) and more men who worked 40 hours or more per week (60% of men compared to 28% of women). For example 8% of men worked 1-19 hours, compared to 23% of women. Conversely, 6% of women worked 49 hours or more, compared to 22% of men.
Persons Who Were Working at February 2010, Usual hours worked


The rural independents have also emphasised that stability is very important to them, with Oakeshott observing that 76 votes is vulnerable to just 1 by election or crossing the floor. This also would argue for them to support Labor since it would have a 2 seat buffer – 100% more than the Coalition.
“men certainly work longer” I think you mean paid work.