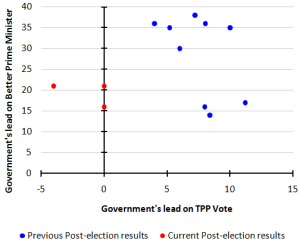
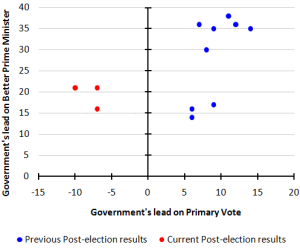
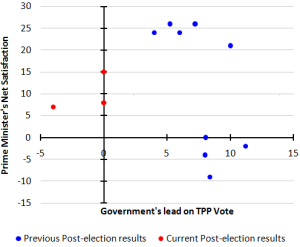
You may have noticed that we’re not paying much attention here at the moment to political polling. The reason for that is that since the polling machines started winding back up, the results they’ve produced have been a bit odd. Not necesarrily wrong mind you, but just odd. We’re seeing Satisfaction/Approval ratings and Better/Preferred PM changes not being particularly consistent with voting intention changes and some of the relationships not being particularly consistent with history.
Mumbles highlights one of these odd things with a difference popping up between respondent allocated preferences and 2010 election preferences for instance. Another couple of examples can sort of be done visually, where we can look at how the government’s two party preferred and primary vote leads stack up against the PM net satisfaction and Better PM ratings for the first 3 polls after every government re-election since 1993 (so we knock out 1996 and 2007 as they were new governments, and we can’t use 1998 because of the One Nation effect stuffing up the polling – as it always does with these things, which is why I always leave it out).
First, the table of the data being used (it’s Newspoll data where the early years are my calculations of TPP from election preferences, as Newspoll didn’t publish many TPP results back then)
Now the charts:
As you can see, the current polling results are a little isolated compared to previous years of a returning government. There’s some more complex relationships between them as well that are also a bit odd at the moment, like how changes in one metric aren’t flowing through into changes in other metrics at a rate and consistency that we generally witness – but that isnt unusual for polling taken early in the term of a government. It usually takes three months or so for the public to start paying political attention again after an election, snapping the dynamics back to their usual spectrum of behaviour.
So we’ll kick back into gear on the polling side maybe the next polling cycle or so – but we shouldn’t be surprised if it’s not until next year that the polling dynamics go back to normal.
There was also a poll in the field over the last few weeks that should hopefully be published somewhere soon, which suggested that much fewer people are paying attention to Federal politics at the moment than they were at this same point after the last three elections.
So take ’em all with a bit of a grain of salt for a while, though the non-voting intention questions like “what do you think about policy X” stuff should still be worthwhile – just don’t be surprised if we get the odd result with a relatively higher number of ‘don’t know’ responses than usual.


Crikey is committed to hosting lively discussions. Help us keep the conversation useful, interesting and welcoming. We aim to publish comments quickly in the interest of promoting robust conversation, but we’re a small team and we deploy filters to protect against legal risk. Occasionally your comment may be held up while we review, but we’re working as fast as we can to keep the conversation rolling.
The Crikey comment section is members-only content. Please subscribe to leave a comment.
The Crikey comment section is members-only content. Please login to leave a comment.