With three separate polls having been released over the last couple of months gauging public opinion on same sex marriage, it’s worth taking a squiz at how opinion has changed over the last few years, as well as breaking the results down to look at how there is a fairly wide variation on views among demographic cohorts.
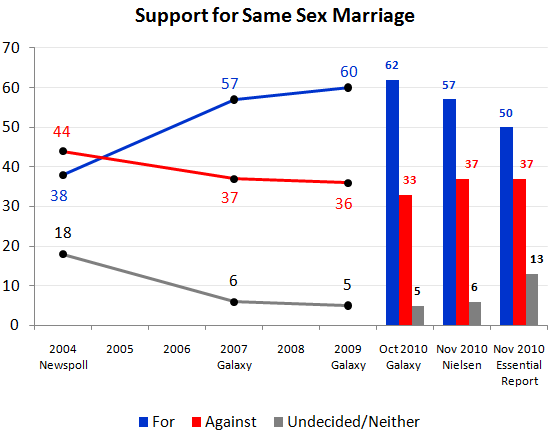
First up, this is what the polling looks like going back to 2004 – the lines are the historical time series, the column charts are the polls from this year.
Over the longer term, we’ve see support for same sex marriage increase throughout the community – however, over the last two months, something interesting may have happened.
When it comes to issue polling in Australia, there’s a substantial proportion of the population whose mental autonomy on any given issue is fairly questionable, where they believe (or at least, say they believe) whatever their position is of the party they vote for. If a party changes its policy from supporting some particular issue to opposing it, so too does a significant chunk of the population. We witnessed that with the CPRS debate, where we saw a decent level of support for it from Liberal Party voters under Turnbull, but then a few weeks later under Abbott’s leadership, that support collapsed.
What we’ve seen over the last few months is the issue of same sex marriage getting a much higher profile in the media and politics than usual – so I wonder if what looks to be the recent, short term decline in support is simply a function of a number of politicians being loud in their public opposition to the idea of same sex marriage?
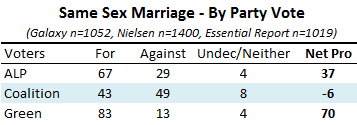
We can slice and dice these polls in a number of ways to see what is happening underneath the top line numbers. Firstly, we can pool all three polls to look at support by party vote:
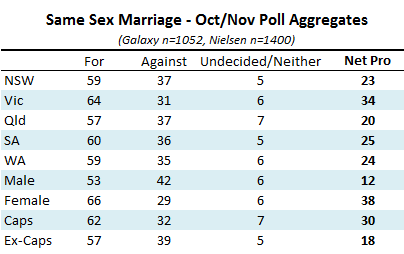
We have a somewhat expected result of the ALP vote being moderately for the issue, the Coalition vote being weakly against the issue and the Greens vote being very strong on the issue. If we pool the Nielsen and Galaxy polls, we can also get some breakdowns by geography and gender:
Queensland is the weakest state on the issue – which goes a long way to explaining the politics involved by both sides. Regional marginal Qld seats particularly are somewhat vulnerable over the issue as they have long been among the seats in Australia most opposed to the same sex marriage.
Note too the large gender split on the issue, with men being 13 points behind women on the level of support.
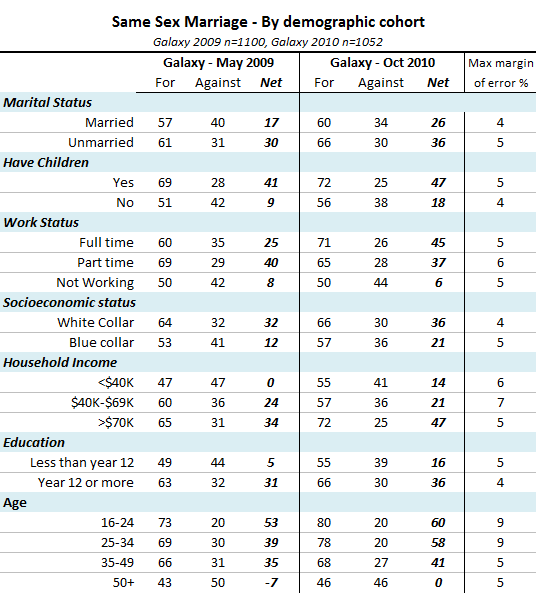
Finally, it’s worth having a closer look at the Galaxy results over 2009-10 and how they changed, as they provide us with all sorts of income, age and socioeconomic cross-tabs. I’ve added the approximate margins of error for each cohort in the table below, just to give an idea of the uncertainty behind any result.
What we see is that those folks less educated, older, childless, male and on lower incomes either not working or working in blue collar occupations are more likely to oppose, while those with higher education, younger, female and on higher incomes working in white collar jobs are more likely to support same sex marriage.


Crikey is committed to hosting lively discussions. Help us keep the conversation useful, interesting and welcoming. We aim to publish comments quickly in the interest of promoting robust conversation, but we’re a small team and we deploy filters to protect against legal risk. Occasionally your comment may be held up while we review, but we’re working as fast as we can to keep the conversation rolling.
The Crikey comment section is members-only content. Please subscribe to leave a comment.
The Crikey comment section is members-only content. Please login to leave a comment.