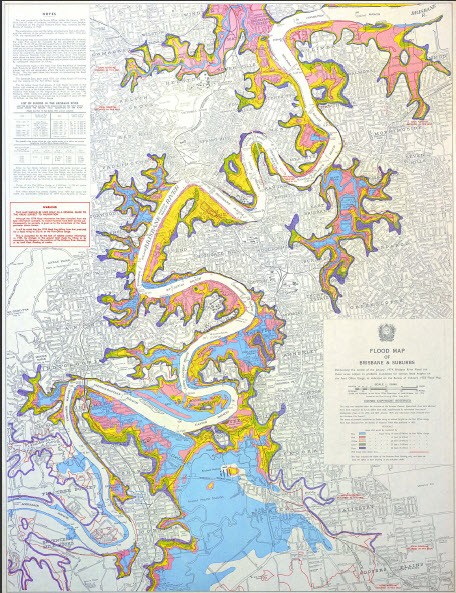
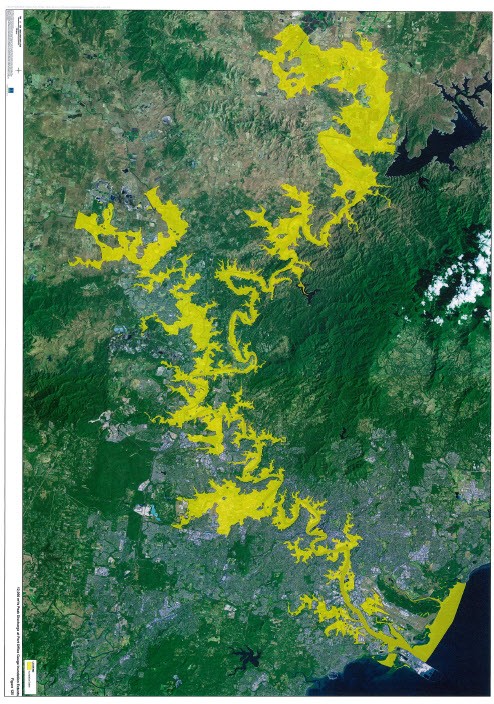
During this morning’s press conference Queensland Premier Anna Bligh continued to evoke Queensland’s devastating floods of 1974 to give Queenslanders, especially those in Ipswich and Brisbane today, an indication of what lay ahead.
As Brisbane-based writer John Birmingham mused at the Brisbane Times today:
“In Queensland, ’74 is shorthand, especially in Brisbane. Knowing of ’74, understanding it and what it might mean, separates the natives from the hundreds of thousands of blow-ins who’ve arrived in the past 10 or 15 years.
“It was the year of the last great flood. If cities have memories, ’74 is a haunted memory for this city. It all but drowned. To invoke ’74, as the mayor did after Toowoomba, was to warn the city something awful was coming. Potentially as bad as Toowoomba, possibly worse.”
But Bligh did qualify her comments. She pointed out the fact that the cities of Ipswich and Brisbane are very different to the cities of ’74. Consider the population influx in that time, not to mention the amount of development, she stressed. “Southbank didn’t even exist in 1974,” she noted, as an example of how difficult it is to anticipate the level of damage set to hit in the coming days.
Crikey has put together a quick compare and contrast — we haven’t been able to obtain a ’74 map of Ipswich at this stage, but we’ll update this as soon as we do.
One of the major differences between the 74 map of Brisbane and 2011 is the presence of the Wivenhoe Dam, built on the Brisbane river about 80km from Brisbane. According to the SEQ Water website, the dam was designed by the Water Resources Commission and built in 1984.
Its primary function is to provide a safe and reliable water supply to the south-east Queensland region, but during a flood situation Wivenhoe Dam is designed to hold back a further 1.45 million megalitres on top of its normal storage capacity of 1.15 million megalitres.
The SEQ Water website states: “Wivenhoe’s flood control facility, together with the existing flood mitigation effect of Somerset Dam, will substantially reduce the heights of relatively small floods. It is anticipated that during a large flood similar in magnitude to that experienced in 1974, by using mitigation facility within Wivenhoe Dam, flood levels will be reduced downstream by an estimated 2 metres. Full supply level or 100% capacity (in the water level analysis) is indicative of the optimum level intended for town water supply, and does not take flood mitigation levels into account.”
But last night the Wivenhoe was at 190% with water levels falling slowly. As Birmingham points out: “…the engineers have no choice. They must open the floodgates and release as much water as possible — water that will flow down on the city, pouring over the banks of the river and into any dells, valleys, homes and apartments in its path.”
Brisbane in 1974 and now:
- 2,037,197 people vs 3,904,532
- 665,112 dwellings (houses, around 50% of which were weatherboard, and 30% of brick) vs 1,660,750
- 70% of that growth has been in individual houses not apartments
- In 1976, only 70% of people had access to the sewage system
Click on the map below for a larger image of the 1974 flood map:
And click on the image below for a larger version of the 2011 flood map:
Ipswich in 1974 and now:
We’re failing Ipswich here — unfortunately the 1976 census doesn’t break down any further than Queensland in general. The 2009 census does, however:
- Approx 1000 square kilometres
- 162,383 people; 148.9 people per square kilometre
- 16.5% migrant population (low, average is 25%), no aboriginal population
- 47,137 households
- Of note: in 2006, only 60% of all dwellings had access to the internet
- Average income is 45,365 (same as average of Australia)
- Collectively, Ipswich has 107,406 registered motor vehicles
- As Queensland’s oldest provincial city, (founded in 1824) Ipswich has more than 6000 heritage-listed sites. It is renowned for its architectural, natural and cultural heritage.
- In 1918, all businesses in Ipswich were built on less than 10 streets.


note wivenhoe dam reportedly has potential to drop brisbane peak flood level by 2 metres.
if 100 % full water supply capacity is 1.15mml
the extra 1.45 mml flood water retention capacity = 226% max capacity (water supply terms) – note management letting go at 190% capacity – not above 200%
if say $500mn were spent on dams in the bremner river & tributaries above ipswich – are there any estimates on what further drop in brisbane max flood levels would be & what drop in ipswich peak flood levels would be.
expect detailed analysis will be available in the next month or so.
I don’t get this “190% of capacity” :- a bucket, or a glass, has a certain capacity, if it was at 190%, it would still be in the source of my drawn water, or under the running tap, running over, wouldn’t it? How much can Wivehoe actually, potentially, hold, for it to be “full”?