This is an extract from The Science of Climate Change — Questions and Answers, published by the Australian Academy of Science and distributed to members of parliament, every local government authority in Australia and every Australian high school, in August 2010. Crikey will be running a series of extracts, including canvassing common myths.
Global average temperatures have increased over the past century
Measurements from many hundreds of thermometers around the globe, on land and over the ocean, show that the average near-surface air temperature increased over the 100 years to 2009 by more than 0.7°C.
Many of these instrumental records, which began in the second half of the 19th century, were not initially designed to be used for climate monitoring. This means they have to be carefully analysed to deal with changes in instruments, observational practice, location, and the growth of cities (see Box 3).

After accounting for these issues, temperature increases are largest in the continental interiors of Asia and north Africa, regions which are distant from major population growth areas (see Figure 3.1 and Figure 3.2).
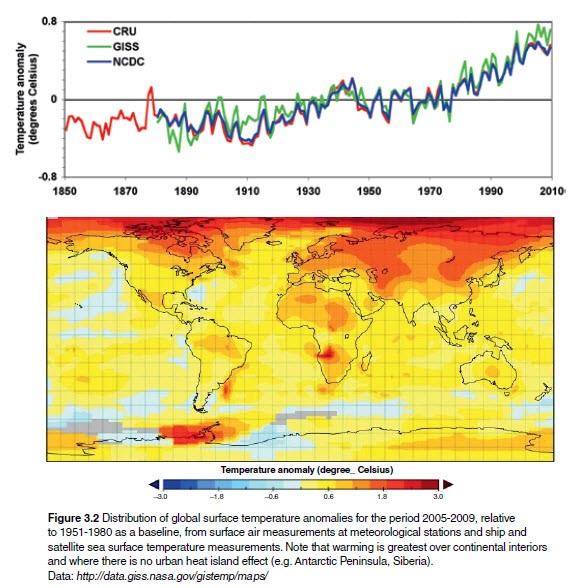
The rates of observed near-surface warming increased in the mid-1970s. Since then, the global land surface has warmed at about double the rate of the ocean surface. Measured warming over the past 50 years was nearly twice the rate of that for the past 100 years.
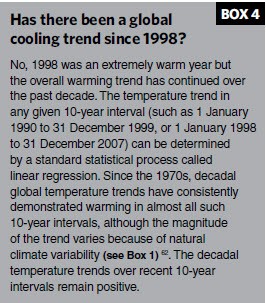
The last decade has been the warmest yet recorded (see Box 4).
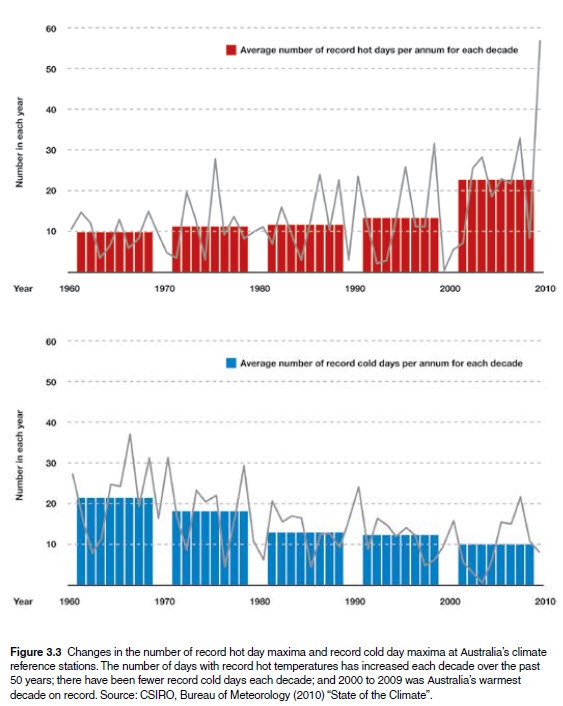
The overall warming has led to an increase in the number of record high temperatures, and decrease in frost frequency and the number of record low temperatures over the past century (see Figure 3.3).
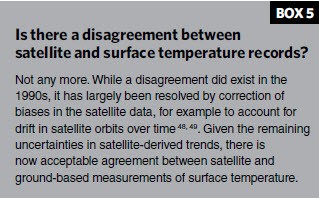
Over the past three decades, satellite observations of temperature at the Earth’s surface and in the lower atmosphere have also shown warming (see Box 5). In contrast to the surface warming, the atmosphere above about 15 km elevation (the stratosphere) has
cooled over the past four decades.
This provides one clue that the observed warming is due to human activities.
The upper 700 metres of the ocean is storing about 90% of the additional heat absorbed by the Earth’s whole climate system since 1961. The surface ocean has warmed by 0.5°C from the 1970s to the early 2000s.
Averaged over the upper 700 metres of the ocean, the average warming is much smaller, only about 0.1°C, but very important because of the large amount of stored heat this represents.
Temperature observations are not the only evidence of recent climate change
- Many other changes have been observed that are consistent with the recorded increase in global average temperature, and indicate some of its consequences.
- There has been widespread melting of mountain glaciers and ice caps. While many of these have been shrinking since about 1850, there has been a significant increase in the rate of average glacier melt since the 1990s.
- Satellite instruments show that the Greenland ice sheet is losing more ice than it gains by snowfall, due to increased surface melting and increased flow of ice into the ocean. The rate of loss of ice from Greenland has risen since the mid-1990s.
- There are strong indications that West Antarctica has also been recently losing ice due to increased ice flow. Most recent estimates show Antarctica as a whole is losing ice.
- Sea level rise is an inevitable consequence of global warming because ocean water expands as it warms, and because melted ice from the land adds more water to the oceans.
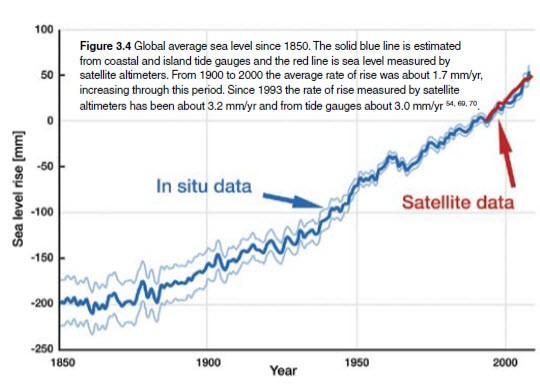
- The rate of rise increased from the 19th to the 20th centuries, with the result that ocean levels are now more than 20 cm higher than in 1870. Satellite and coastal measurements show that the rate of sea level rise since the early 1990s has been substantially larger than the average rate for the 20th century, and larger than for any similar length period in the historical record (see Figure 3.4).
- The observed rise is consistent with increased rates of ice melt and ocean warming. Arctic sea ice extent has decreased significantly in all seasons, but particularly in summer, since satellite records began in 1979. Submarine observations suggest that the Arctic Ocean sea ice thickness has decreased since 1958, and satellite measurements indicate a thickness decrease of about 0.6 metres between 2003 and 2008.
- However, in the Southern Ocean, total sea ice extent has increased slightly.
- The average water vapour content in the atmosphere, both at the Earth’s surface and higher in the atmosphere, has been increasing at a rate of 1–2% per decade since reliable measurements began in the 1980s. The greater intensity of heavy rains expected from this increasing humidity has been observed in some regions. Observed changes in ocean salinity are consistent with intensification of the water cycle over the oceans.
- There is evidence of a shift in weather systems toward the Earth’s polar regions, and an apparent strengthening in the winds over the Southern Ocean over the last 40 years. This is believed to have contributed to observed warming over the Antarctic Peninsula and Patagonia, to cooling over eastern Antarctica and the Antarctic plateau, to associated changes in sea ice and the Box 5 ocean, and probably to the decreases in rainfall over south-western Australia.
- There are indications of recent changes in the temperatures and salinities of deep ocean currents such as those which carry North Atlantic water southward at depth and Antarctic bottom water north.
Australia’s climate has changed along with the global climate
In Australia, the average surface temperature has increased by about 0.7°C since 1960, with some areas having warmed faster and some showing relatively little warming (see Figure 3.5). The warming has caused an Australia wide average increase in the frequency of extremely hot days and a decrease in the frequency of cold days (see Figure 3.3).
While the longer term trends in rainfall are less marked, there have been significant increases over north-western Australia, and decreases over south-western and south-eastern Australia since 1960 (see Figure 3.6). The warming and decreased rainfall over south-east Australia
have exacerbated the background conditions conducive to fire. In southwest Western Australia and the southeast coast, there is evidence for a systematic decline in rainfall in recent decades, and for declining trends in storminess.

It is likely that these trends are related to shifts in pressure patterns over southern Australia, particularly the intensification of the subtropical high pressure belt.
Regional ocean currents have also changed. For example there has been a southward shift of the Antarctic Circumpolar Current and an increasing southward penetration of the East Australian Current, associated with wind changes in the South Pacific.
Sea level has risen around Australia at a rate of about 1.2 millimetres per year since 1920, resulting in coastal inundation events becoming more frequent. Since the establishment of the Australian Baseline Sea-level Monitoring Project in the early 1990s, sea level measured relative to the land has risen at about 2 millimetres per year in the south east, and over 8 millimetres per year in the north west.
The Australian Academy of Science, which represents Australia’s foremost scientists, provides scientific advice to policy makers and promotes excellence in Australian science, has devoted considerable resources to untangling the science of climate change and presenting it in a simple and easily understood format.
The full report can be downloaded here for free.


Just a question–don’t bite my head off–could some of this be caused by deforestation and aridification acting on the climate through surface changes to albedo and water cycles, independently of the greenhouse-gas mechanism?
@ FreeCountry
Yes and volcanic activity and methane from cattle / beasts.
@ Freecycle, Deforestation and aridification also release CO2 equivalent (burning and rotting vegetation and increases in livestock on the resulting land). As deserts and clear land have higher albedo than forests, albedo change would actually be a cooling influence (hence Stephen Chu’s suggestion that we should paint all roofs white ). This is one of the reasons melting arctic ice is a concern; as the ice melts the albedo drops leading to the ocean absorbing more heat in a vicious cycle.
There are some changes in the water cycle due to the dramatic increase in irrigation across the world leading to higher evaporation rates, but the effect on temperature is an order of magnitude or two lower than that caused by CO2.
Indeed, freecountry, something that strikes me looking at the 1960-2009 rainfall anomaly map is how many of the greatest rainfall declines are concentrated around areas where urbanisation has replaced vegetation. I wonder if there are some local effects going on there (aerosol or particulate pollution and/or drop in transpiration, as well as albedo change), superimposed on the more regional and global trends.
Deforestation does have a definite impact on local climate, which exacerbates the climate change problem where it occurs.
On the other hand, there is the potential to quickly reverse warming on a local scale through innovative solutions that address this phenomenon, like this one:
http://arstechnica.com/science/news/2011/03/switching-biofuels-could-do-a-double-whammy-on-climate-change.ars
However, this is all independent of the global impact of climate change. Most of the energy introduced into the climate system is trapped in oceans, and there isn’t much we can do to reduce that problem by using mechanisms that address the issue on a local scale. Also, many of the places experiencing the largest warming are well away from any population centres.
The struggle to halt the global warming trend will be helped by local solutions (which have global benefits anyway), but it will also require a real effort to transition to a low-carbon economy. In the end, all the models show that the root cause of climate change is greenhouse gases, so they should be the primary target of any efforts.