This is an extract from The Science of Climate Change — Questions and Answers, published by the Australian Academy of Science and distributed to members of parliament, every local government authority in Australia and every Australian high school, in August 2010. Crikey will be running a series of extracts, including canvassing common myths.
Human activities are increasing greenhouse gas levels in the atmosphere
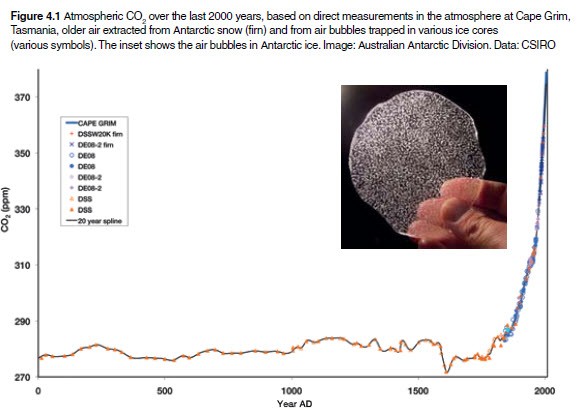
The concentrations of greenhouse gases in the atmosphere are well known, from modern measurements and by analysis of the air from past eras, trapped as bubbles in ice from Antarctica and Greenland (see Figure 4.1). These observations tell us that atmospheric concentrations of CO2, methane and nitrous oxide began to rise 200-300 years ago, after changing relatively little since the end of the last Ice Age thousands of years earlier.
This increase in greenhouse gas concentration happened around the same time as industrialisation, when the global human population began growing rapidly and farming also increased. The growth in greenhouse gases has accelerated through the 20th century to the present (see Figure 4.1).
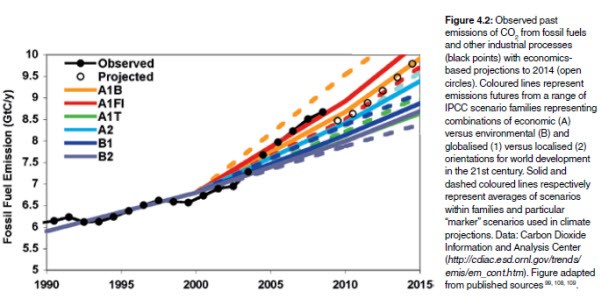
Studies of the stores and sources of these gases, natural and human induced, show that the main causes of the increasing concentrations are emissions from human activities (see Figure 4.2).
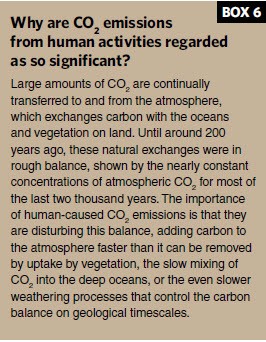
Human activities cause CO2 input to the atmosphere from fossil fuel burning, other industrial sources such as cement production, and deforestation.
Measurements over the past 50 years show that only about 45% of the combined CO2 emissions from these sources remain in the air to cause atmospheric CO2 to rise. About 25% of the total CO2 input is being absorbed by the oceans, making sea water more acidic, and the remaining 30% is being taken up on land, with the largest probable cause being increased growth of plants (see Box 6).
This is shown by a wide range of measurements and models.
There has been a recent acceleration in the growth rate of CO2 emissions from fossil fuels and industrial sources. From 2000 to 2007 these emissions grew by 3.5% per year, exceeding almost all assumed scenarios generated in the late 1990s. This pulse of CO2 emissions growth coincided with a period of rapid global economic growth. There will be a small, temporary downturn in CO2 growth, associated with the 2008–09 global financial crisis.
It is very likely that most of the recent observed global warming is caused by increasing greenhouse gas levels.
It was predicted more than a century ago that increases in CO2 would act like added insulation in the Earth’s atmosphere, trapping more heat near the surface. This extra CO2 was also predicted to make the stratosphere colder (see Question 1).
Satellite measurements over recent decades have confirmed the extra insulating effect not only of CO2, but also of each additional greenhouse gas. Moreover, trends over the past 40 years, superimposed on natural year-to-year variations, have been observed which show that the upper atmosphere has cooled and the surface of the Earth and the lower atmosphere have warmed significantly (see Question 3 and
Boxes 1, 4 and 5).
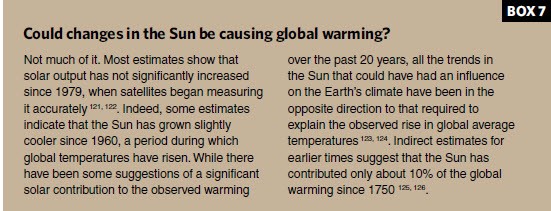
These are the predicted consequences of the additional levels of greenhouse gases. In contrast, the lower and upper atmosphere might have been expected to have warmed if the amount of the sun’s energy being received by the Earth had increased (see Question 1 and Box 7).
As well as emitting greenhouse gases, human activities affect climate through the release of small particles in industrial haze, which reflect sunlight. The amount of cooling by this pollution is not known precisely, but is likely to be offsetting some of the warming from the increases in greenhouse gases. Another way humans change local climates is by changing land use, building cities, or introducing irrigation. These changes can affect the amount of sunlight reflected from the surface, local wind flow and evaporation.
The impact of these effects in recent decades has been small on a global scale.
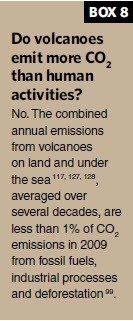
Natural factors that have changed climate in the distant past, such as the brightness of the sun or volcanic activity, have made only a small contribution to recent climate change (see Boxes 7 and 8).
Putting all these factors together, the observed global warming during the past century has been consistent with that expected from the combination of increasing greenhouse gases and increasing particulates, with small contributions from other factors.
Some recent Australian climate changes have been linked to rising greenhouse gases
Modelling studies indicate that rising greenhouse gases have made a clear contribution to the recent observed warming across Australia.
Decreases in atmospheric ozone over Antarctica and increases in greenhouse gases are also likely to have contributed significantly to climate trends that have been observed over the Southern Ocean in the past few decades, including stronger westerly winds and the southward shift of weather systems.
The human contribution to the recent observed rainfall increases in north-west Australia and decreases in southern Australia cannot as yet be clearly separated from natural climate variations. However, the decreases in rainfall in southern Australia have been linked to stronger high pressure weather systems.
The overall pattern of increasing pressure in mid-latitudes and decreasing pressure at high latitudes over time in the Southern Hemisphere is consistently seen in climate model projections and is therefore likely to be due to human-induced climate change through a combination of increases in greenhouse gases and decreases in stratospheric ozone.
The Australian Academy of Science, which represents Australia’s foremost scientists, provides scientific advice to policy makers and promotes excellence in Australian science, has devoted considerable resources to untangling the science of climate change and presenting it in a simple and easily understood format.
The full report can be downloaded here for free.


The answer is a resounding “YES” – humans ARE having an increasingly detrimental affect on the environment. However, what we do or don’t do down here (in Australia) will not make one scrap of difference. Having just returned from China and seeing the unbelievable, unregulated pollution along the Yangtze River is mind boggling! The Yangtze is a FREEWAY of uncovered cargo ships servicing China which is relishing its role as the factory to the world. I saw cargo ships roll over pouring huge loads of sulphure into the Yangtze River (which is never retrieved). In fact, these type of disasters rarely make the local papers! Problem is that China does not give a rat’s behind about the environment and pays scant attention to the working conditions of its citizens. All along the Yangtze (and throughout huge cities like Chongqing) there are factories operating 24:7 and pouring so much crap into the air and the River systems, it is really scary! This goes on and on and because it is not reported in the Chinese papers, and Chinese politicians turn the other way, Chinese nationals are just grateful for a job and don’t seem to even notice the increasing horrific nature of their chokingly polluted environment. Add to this, the Indians, Russians and Americans – you get the picture? Just thank God we live in the southern hemisphere but the dreadful pollution of our northern neighbours will affect us all in time.
Wow, the ultracapitalist big oil funded astroturf brigade appear to have missed this thread entirely.
“Please consider the environment before building a wind farm.”
Mike Hulme
Den Brook Judicial Review Group, United Kingdom.
Salstar, environmental degradation is a major reason for increasing chinese uprisings and demonstrations against their government, usually brutally suppressed, which is one reason the chinese government is cracking down as hard as they can on polluters.
Could some one please show me where that evidence is that Global Warming is actually caused by man. There are lot’s of “likely”, and “may impact” comments around, but nothing that says we do.
Using the IPCC own numbers:
Carbon Dioxide in the atmosphere: 0.039%
Produced by Man: 3% of 0.039% = 0.001170%
Produced by Australia: 1% of 0.001% = 0.0001170%
The IPCC science models do no include water vapour or cloud cover in their models. How can you have forcast models that do not include water vapour????
I am all for eliminating pollution, but I do not believe that Carbon Dioxide is a pollutant, and I don’t believe it is responsible for current warming.