A major new analysis of public source attendance data for Australian performing arts companies, published today by Crikey, reveals stagnating audiences across the sector.
Crikey analysed data from 17 large opera, music, theatre and dance companies from 2007 to 2011. The results will make for sleepless nights across the boardrooms of major performance organisations.
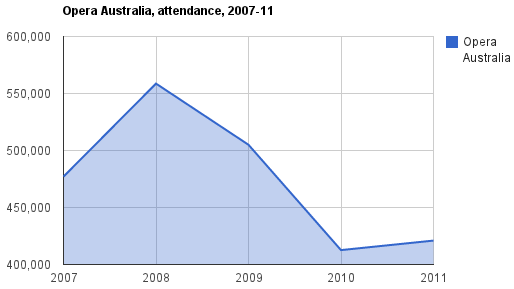
Most companies are shedding audiences, and attendances in total have declined by 6% over the past five years. Of the 17 companies Crikey surveyed, 10 have seen declining audiences since 2007. Perhaps most worrying, this figure includes all six of the largest performing arts companies with audiences of more than 200,000 annually. Australia’s largest performing arts organisation, Opera Australia, is down about 130,000 attendances from its 2008 peak.
However, it’s not all doom and gloom. Arts companies in the west are bucking the trend. Companies based in Perth are taking advantage of a booming economy, new venues and an increasingly culture-hungry local audience to record impressive growth in their total attendances. In particular, theatre company Black Swan has more than doubled its footprint, while the Western Australian Symphony Orchestra and the Western Australian ballet are also showing healthy gains.
The other stand-out performers are Melbourne’s Malthouse Theatre and the Australian Chamber Orchestra, both of which added significant new audiences in the five-year period.
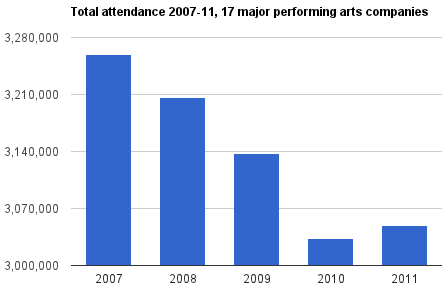
Attendance figures for 17 major Australian performing arts companies between 2007 and 2011. Total attendances fell from 3.26 million to 3.05 million in that time.
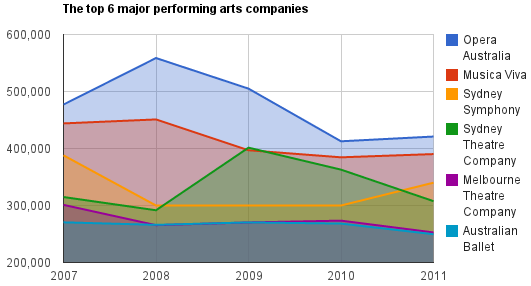
Australia’s six largest performing arts companies, with audiences of more than 200,000 annually, all recorded smaller audiences last year than in 2007. The top six have seen audiences decline at an average of 2% a year.

Led by Black Swan, Western Australian companies are recording audience growth at a time when many other organisations are declining.
Another way of representing audience growth is to use a so-called “radar chart”. In this chart, 2007 attendances are scaled to 100 and increases or decreases are expressed as a ratio to that. The graph demonstrates the growth of Black Swan as the stand-out performer.
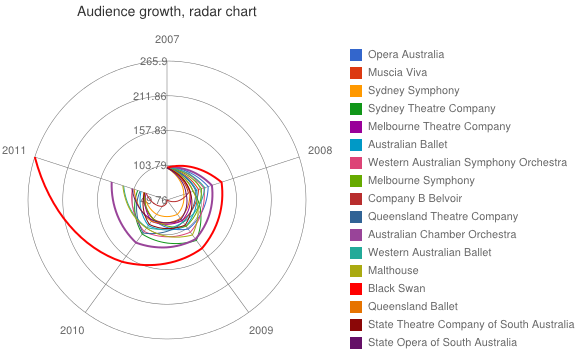
Radar chart showing companies’ audience movements. Figures are in percentages with 2007 audiences for each company scaled to 100.
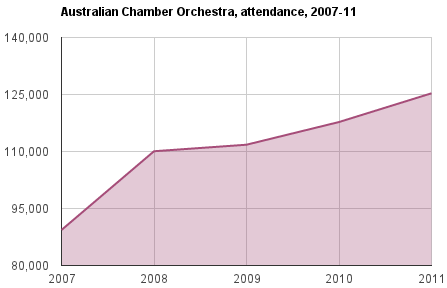
Let’s look at a few individual companies to get an idea of the various trajectories. The Australian Chamber Orchestra is by far the best-performing east-coast company, with a strongly growing audience base driven by expanding touring.
On the other hand, Opera Australia, the nation’s largest performing arts company, is well down on its 2008 peak of 559,000, although it has some sold-out Ring Cycle productions still in the pipeline.
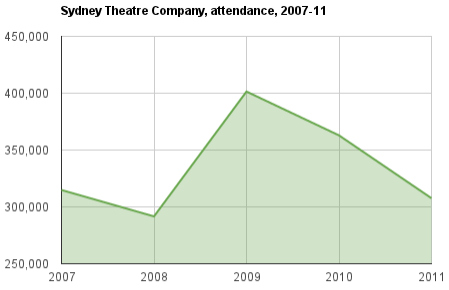
In contrast to companies such as Black Swan and the Australian Chamber Orchestra, most performing arts companies have experienced slow declines in their audience bases, perhaps reflecting the generally cautious Australian consumer. Even high-profile companies such as the Sydney Theatre Company are struggling with audience downturn in recent years, as Crikey reported recently.
Longer-term trends may also be at work: Australian Bureau of Statistics data shows the percentage of Australians attending performing arts events such as classical music concerts, operas and the theatre has barely changed in more than a decade. The most recent Australia Council data for the sector also backs up this. According to the Securing the Future report of 2010, total paid mainstage capital city attendances for the sector were 1.996 million in 2002 and 2.061 million in 2009 — an increase of only 3.25% in eight years.
Whatever the reasons, the flatlining aggregate attendance data suggests that all is not well with our nation’s flagship performing arts institutions. At a time of ever-expanding options for the culturally minded consumer, our nation’s largest orchestras, operas and theatre companies face significant challenges in maintaining and renewing their audiences in the coming decade.
Want to delve into the data more deeply? Crikey has put together a Google spreadsheet of the data we collected. You can access the full data table, as well as audience charts for every company that provided data.
*Crikey approached 28 of Australia’s so-called “major” performing companies, asking for their total annual attendance figures for the past five years — 17 organisations replied. The companies were asked to provide a figure for their total annual attendance, including workshops, non-mainstage events, free events and tours. Data was then entered into a Google spreadsheet for analysis. We welcome further submissions to the database — all figures should be emailed with an attention to Ben Eltham in the subject line to boss@crikey.com.au.


Thanks Crikey for publishing the raw data.
I think the graphs are a bit misleading with the auto scaling google docs applied. For example the Belvoir attendance graph shows a giant crash for 2009 which was ‘only’ (heh) a 30% drop in tickets. Better to use graphs with a minimum of 0 or show both absolute numbers along with percentage change.
the increased attendance at Western Australian companies, and Black Swan in particular, can simply be explained by the fact that until last year Perth did not have a decent modern facility for theatre.
the opening of the State Theatre Complex is possibly the sole reason for the increase in attendences, but praise is due to Black Swan for making the most of the opportunity and commissioning new work for the venue
I wonder what difference it would make if you’d looked at smaller theatres as well. In my opinion, by far the most important theatre in Australia is Red Stitch and I imagine in its modest expansion over recent years it must have taken some custom from other theatres. There might be others too.
Very interesting data, Ben
As someone who does some work in this area, it’s clear one key factor is the quality and buzz of what’s performed. The 2011 Live Performance Australia (LPA) Ticket Attendance and Revenue Survey (p34) notes a massive jump in attendances in Sydney last year due to the success of the touring production of Richard III.
More generally, and looking longer term than your data, theatre audiences have an interesting demographic change. This is evident in the ABS data (catalogue 4144.0) for the age groups of people attending theatre over the past 15 years:
15-34 age group 1,054,000 in 1995, 894,000 in 2009-10
35-55 age group 880,000 in 1995, 1,084,000 in 2009-10
55+ age group 402,000 in 1995, 868,000 in 2009-10
(the overall number of people attending theatre grew by 22%, just less than the 24% for the overall population)
So theatre lost young people – but more than doubled the number of 55+ people coming along. As you argue, this too differs a little between States
Tony Ward
Milbur Consulting, Melbourme
Belvoir’s figures are completely skewed by the fact that we had Keating! playing in a number of large venues around the country in 2007 and 2008. The company’s audiences in its home venue have actually grown signficantly in the period 2007-2011.