Earlier this week I looked at a new survey of public transport use by the Australian Bureau of Statistics (ABS). My interest then was in how many people use public transport.
This time I’m looking at what the ABS survey tells us about why travellers use public transport. The Bureau asked a sample of adults living in Melbourne who’d travelled by public transport at least once in the previous month to give the main reason why they used it.
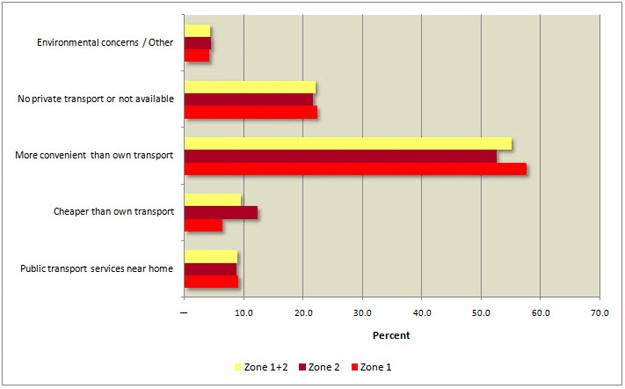
The answers were classified into five categories (see exhibit). As I noted last time, it’s important to bear in mind that more than half of adult public transport patrons aren’t everyday users – in Melbourne, 59% of them use public transport two days a week or less.
The exhibit shows around a quarter are ‘committed’ public transport users. 22% say their main reason for using public transport is they “have no private form of transport; or own transport is unavailable.” A further 4% say they’re motivated by “environmental concerns.”
What stands out to me, though, is the high proportion of patrons who implicitly see driving as the default option.
The most common reason by far for using public transport – offered by 55% of patrons – is because it’s “more convenient than own transport; less stressful; or reduces travel time.” Another 9% say “it’s cheaper than own transport.”
Combined, these two reasons account for nearly two thirds (64%) of users. These patrons are ‘uncomitted’ – they only use public transport in situations where they effectively can’t drive.
The implication is public transport has to out-compete the car before this group will forego driving. It’s not sufficient to have good public transport (although that’s a necessary condition) – it has to provide a service that’s superior to the alternative.
That’s a very tall order. The only way it can happen is if driving is made more costly in dollars and minutes relative to public transport. At present, those conditions mostly only prevail in the city centre, where traffic congestion and high parking charges put cars at a disadvantage.
This goes directly to a key point I’ve made before. Achieving a really substantial mode shift requires that travel by car be made more expensive relative to public transport, either in terms of financial cost or time cost.
That might happen gradually by doing nothing e.g. as a result of increasing traffic congestion. Or it might be hastened by deliberate policy e.g. road pricing, higher parking charges, higher fuel taxes, lower fares.
In my last post on public transport I said it shouldn’t be seen solely as a replacement for cars. Rather, it should be seen as an alternative for some trips and a complement for others.
This discussion indicates it’s also important to understand that cars and public transport are two sides of the same coin. Where the goal is to significantly increase public transport’s mode share, their relative cost matters enormously and action needs to be taken on both.
So far as the other reasons given by respondents are concerned, it’s clear that only a small number of patrons (4%) say their main reason for using public transport is “environmental concerns.”
That doesn’t surprise me at all, but it’s notable because others have suggested as many as a fifth of Melburnians use public transport because it’s environmentally the right thing to do. The ABS’s findings don’t support that contention.
Geography doesn’t seem to matter much either. The proportion who offered “environmental concerns” as their main reason for using public transport is the same for patrons living in the inner-middle suburbs (Zone 1 in the fare structure) as it is for those in the outer suburbs (Zone 2).
Geography also has no impact on those patrons who use public transport because they “have no private form of transport; or own transport is unavailable.” 22.3% of patrons who live in Zone 1 offered this reason compared to 21.6% in Zone 2.
And the proportion who say their main reason for using public transport is because they “have public transport services near home” doesn’t vary geographically either. It’s 9.1% in Zone 1 and 8.7% in Zone 2.
This is surprising because public transport is a better option closer to the city centre. That would seem to be confirmed by the ABS’s finding that 57% of Zone 1 residents used public transport in the last month compared to 29% in Zone 2.
It’s possible this absence of spatial variation is a result of the ABS’s methodology – perhaps it’s an artifact of only asking patrons for a single, major reason. Maybe understanding who uses public transport will provide some clarity – I’ll look at what the survey has to say on that score shortly.


Crikey is committed to hosting lively discussions. Help us keep the conversation useful, interesting and welcoming. We aim to publish comments quickly in the interest of promoting robust conversation, but we’re a small team and we deploy filters to protect against legal risk. Occasionally your comment may be held up while we review, but we’re working as fast as we can to keep the conversation rolling.
The Crikey comment section is members-only content. Please subscribe to leave a comment.
The Crikey comment section is members-only content. Please login to leave a comment.