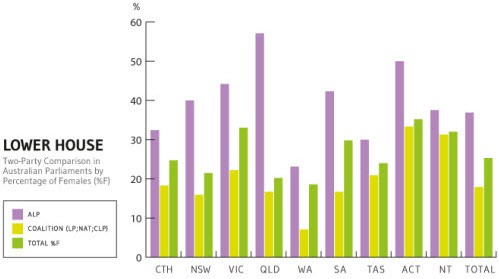
A big weekend of election results around the country has seen the ACT retain its crown as having the highest proportion of women in any parliament in the country — although it has slipped somewhat.
A state-by-state analysis for Crikey has found that Victoria and the Northern Territory also rank relatively highly for female representation in their lower houses, while Western Australia (where just 7% of lower house Coalition MPs are women) comes in last. Looking at MPs from the two major parties across the country’s lower houses (and federal Parliament), about a quarter of MPs are women.

Before the recent ACT 2012 election, women made up 41% of the unicameral Legislative Assembly. That’s now 35%. The slide in representation is largely due to female Greens MLAs (Meredith Hunter, Amanda Bresnan and Caroline Le Couteur) being replaced by two Liberal Party men (Andrew Wall and Steve Doszpot) and Labor’s Yvette Berry. The make-up of the new ACT Assembly repeats a long-term trend across the nation, with Labor significantly ahead of the Coalition in its representation of women in parliament. Labor women in the ACT have now achieved parity for the first time, with a 50-50 split of seats between the s-xes:

There’s nothing new about these results; the Coalition has long trailed Labor in the proportion of women MPs. But until the recent gender wars sparked by the treatment of Prime Minister Julia Gillard, these statistics were not generally highlighted. Now, with Essential Media revealing gender fault lines among voters at a federal level, and the PM’s approval rating improved by five points following her misogyny speech to Parliament, there is little doubt that how the major parties represent women is more significant. These tables show the state-by-state breakdown:
Lower houses (%)

Upper houses (%)

Total for all parliaments (%)

If numbers count in the gender war, the Coalition is now at a considerable disadvantage in every parliament in the country. Labor has double the percentage of women in lower houses. It also has the higher number of women in upper houses.
At the 2008 WA election, the Coalition elected only two women out of 28 MPs to the lower house, delivering women the lowest representation in an assembly across the country; just 18.6%. Although the WA figures improve in the upper house to 47.2% this is largely due to the combination of Labor and Greens MPs (both elected more women than men to the upper house; 63.6% and 75% respectively).
In Queensland, where there is no upper house, the election of the Liberal-National Party not only wiped out Labor but the majority of women MPs. Newman’s sweeping victory in March reduced the number of women in the Parliament from 36% to 20.2%. Under Bligh, Labor women neared parity — 49%. Liberal-National women make up only 17% of Newman’s government.


Why would a woman want to run for the Misogyny Party?
Why would men want to vote for a woman running for the Misogyny Party?
Why would women want to vote for a women running for the Misogyny Party?
It’s surprising the Misogyny Party has any women in Parliament.
This data has remained rather static over the past decade. I think Queensland State Parliament deserve a special raspberry: they went from a government which included a female leader & 49% of seats held by women to a new government with a male leader and a 17% representation of women. Thanks to Tanya for her data & analysis.
Why would politicians want to be members of the two parties not much preferred when their first responsibility is to their constituents not other politicians? Edward James