There’ve been a few estimates of the likely cost of Hurricane Sandy to New York thrown about the in media but little to indicate how they were derived. Likewise there’re some guesses in the ether of how long it’ll take before the subways are 100% operational again, but at this stage it’s not at all clear they’re reliable.
As it happens there is some work which provides at least a broad answer to these questions. A study done last year by the New York State Energy Research and Development Authority (NYSERDA), titled Responding to climate change in New York State, looked at a scenario similar to Sandy.
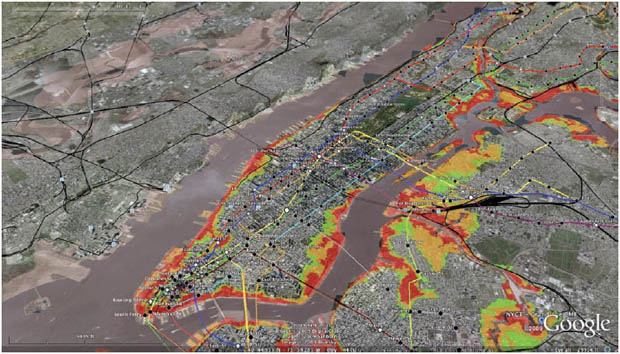
The report includes a case study of how New York City’s transport system might be affected by flooding in the event of a 100 year storm.
This is an assumed storm and can’t be taken as a literal representation of a highly specific (real!) case like Sandy, even if we knew the full extent of the damage done last week. It has to be treated as a guide.
The researchers assume a storm “similar to a non-direct but nearby hit of a category 1 to 2 hurricane”. That nevertheless seems similar to Sandy, possibly a bit stronger.
NYSERDA assumes three scenarios. The base case is the current sea level but it also examines scenarios where sea levels have risen two feet and four feet higher as a result of climate change.
The study predicts widespread inundation of subways and roads in the base case. Draining subways could take weeks although it would depend on the availability of pumps. Less certain is the impact of salt water on signalling and control systems and probably long lead times in obtaining specialised replacement equipment.
NYSERDA estimates it could “easily take” three to six months to restore affected parts of the system to 90% functionality. Restoration to full revenue service “could take more than two years.”
A severe storm would also impose high economic costs from “losses, social disruptions and displacements.” NYSERDA estimates transport-related costs as likely to be in the order of $58 billion, made up of $10 billion in physical damage and $48 billion in economic costs (it can’t be assumed that’s what Sandy will cost, though).
These costs would increase to $70 billion and $85 billion in the event of a storm with sea levels two feet and four feet higher respectively.
NYSERDA says previous studies have indicated that investing in preventative measures yields an approximate 4:1 ratio of benefits to costs. The authors say:
If the 4-to-1 benefit-cost ratio for the protective and other mitigation actions applies, then up to one-quarter of the expected annual losses should be invested every year.
Transport is very likely the biggest component of costs from a storm of this magnitude, but there are others. The estimated all-up cost of Hurricane Katrina is estimated to be $108 billion, of which $81 billion was property damage (although Katrina was much more powerful – a category 3 hurricane – than either the hypothetical storm considered in this study, or Sandy).
The economic costs are the big-ticket item in New York. It’s a dense city with lots of extremely high value activities that’re easily disrupted. It’s dependent on vulnerable, low-redundancy transport infrastructure, most especially rail.
In fact researchers from the University of South Carolina reckon Manhattan is more “socially vulnerable” in the event of a natural disaster than any other county in the US. In a paper published in 2003, Social vulnerability of environmental hazards, they examined the susceptibility of 3,141 counties in the US to harm from natural disasters.
They didn’t look at the likelihood of natural disasters in those counties, just their likely exposure to damage and injury in the event of a natural calamity. They use the term “social vulnerability” in the wider sense of how a disaster might harm the entire population of each county.
The researchers reduced 42 independent variables to 11 factors that differentiate counties according to their relative social vulnerability. Those factors are: personal wealth; age; density of the built environment; dependence on a single economic sector; housing stock and tenancy; race; ethnicity; occupation; and infrastructure dependence.
The authors say the least vulnerable counties are relatively homogeneous i.e. suburban, wealthy, white and highly educated.
The low density of residential and business uses in these counties protects them from physical and economic damage. Their relatively high wealth and social capital facilitate recovery and rebuilding.
The most vulnerable counties are generally in the south from Florida to California. They’re growing fast and have higher levels of racial and ethnic inequality.
However despite being the leading location for “the 1%”, the authors say the most vulnerable county in the US is Manhattan. The Bronx is also in the top five.
They say that’s largely the result of very high density. It appears the downsides of density exceed its strengths when it comes to natural disasters (another dense county, inner San Francisco, is also in their top five).
That’s not an argument against density but an argument for better preventative measures, both physical and regulatory. Federal bail-outs to reinstate beach developments in New Jersey might be smart politics in the here and now, but it’s not good policy).
I can’t help thinking though, that NYSERDA’s estimate of $10 billion for restoring infrastructure is optimistic in a city where new subways cost $2 billion per mile to construct. Like Australia, US infrastructure costs are extraordinarily high.


Crikey is committed to hosting lively discussions. Help us keep the conversation useful, interesting and welcoming. We aim to publish comments quickly in the interest of promoting robust conversation, but we’re a small team and we deploy filters to protect against legal risk. Occasionally your comment may be held up while we review, but we’re working as fast as we can to keep the conversation rolling.
The Crikey comment section is members-only content. Please subscribe to leave a comment.
The Crikey comment section is members-only content. Please login to leave a comment.