Australians think backbenchers are overpaid but support parliamentary entitlements if they’re spent directly on electorate work, polling from Essential Research finds.
Unsurprisingly, 71% of voters think backbenchers are overpaid, a relatively uniform view across voting intention, although Liberal voters are slightly more generous than Labor and Greens voters. Only 27% of voters think current pay levels are about right. They’re opposed to most forms of political expenses — overseas study tours, publications allowances of the kind that George Brandis has enthusiastically exploited, and costs of social events “for networking purposes”, but 70% back reimbursement for travel directly related to electorate work and 53% back a printing allowance to inform their electorate.
There is also strong support for extending regulation of lobbyists. Half of voters support the requirement for anyone who lobbies any MP to register as a lobbyist, not just ministers and public servants, requiring frontbenchers to reveal everyone they meet, and banning former ministers and senior officials from lobbying in their former portfolio for five years.
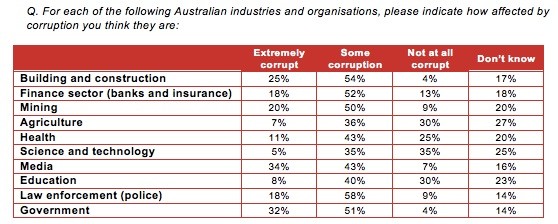
Despite the entitlements scandal, voters think our MPs are less corrupt than politicians in other countries. Around 39% of us think our politicians are less corrupt than US politicians (10% think more corrupt); 20% less compared to UK politicians (11%); 60% less compared to Indonesian politicians and 57% less than Chinese politicians. That’s despite 32% of voters believing government broadly in Australia is “extremely corrupt”.
So what’s the most corrupt industry of all in the eyes of voters? Some 34% of Australians believe the media is extremely corrupt, nine points more than building and construction — something to bear in mind next time national newspapers call for tougher regulation of the construction industry …

On voting intention, there’s minimal change from last week: the government is on 43%, Labor on 35%, the Greens on 10% (up one) and “others” on 12%, for a two-party preferred outcome of 52-48%.


It all in the detail, this is to generalised as a report for it to make sense, or use to me. What are the definitions in each category? What did respondents understand to be corruption in media versus law enforcement versus agriculture? Given there was a relatively low 18% “Extremely corrupt” score for law enforcement but a rather higher 58% score for “Some corruption”, how were both framed in the questionnnaire? Or were they? Could have been useful, but not.