A new analysis by Chris Loader at Charting Transport shows that while Australian cities are continuing to spread outwards, they’re nevertheless getting markedly denser.
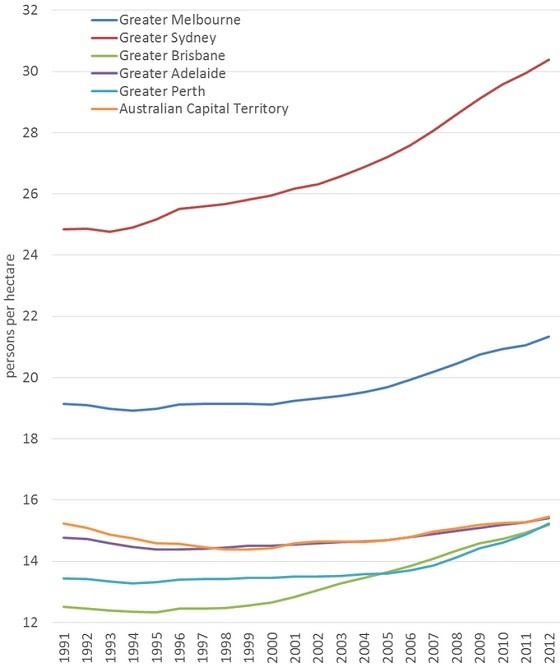
He calculated the changes in population density of Australia’s main cities over the period 1991-2012 and produced the fascinating chart above.
It shows that, contrary to the stereotype, the density of all of Australia’s major cities increased since the 1990s (following a period of falling density from at least 1981). The increase in Sydney and Brisbane over the last ten years was around 15%.
The chart uses the best measure of density – Population-Weighted Density. The virtue of this metric is it takes into account the way variations in density are distributed geographically. It weights the density of each Statistical Area (or other convenient geographical unit e.g. suburb) by its share of the city’s total population.
A way to think of it is that Population-Weighted Density gives equal weight to each person whereas the customary measure – Average Density – gives equal weight to each square metre (1).
As Chris notes, the rise in density was partly the result of increased infill development in established suburbs e.g. town houses and apartments. Many outer suburban growth areas also got denser, largely because the average lot size got smaller in response to deteriorating affordability.
The exhibit shows the convergence of the smaller capitals around 2012 at a similar density (15 persons/Ha), primarily due to big increases in Brisbane and Perth. Although both cities came off a low base, Brisbane certainly went through a vigorous inner city redevelopment phase over the last 25 years.
But what stands out clearly is how much denser Sydney is than other cities; it’s clearly in a class of its own. It’s half as dense again as Melbourne and slightly more than twice as dense as Brisbane, Adelaide, Perth and the ACT (2).
There are a number of factors that help explain Sydney’s high density relative to its peers, ranging from its size to its unique history and the composition of its economy.
Any explanation though would also need to consider the effect of Sydney’s constrained topography/geology and the impact of infrastructure charging policies on development costs.
These factors help explain why the cost of houses on Sydney’s fringe are the highest in Australia. They also help explain why it’s the only Australian capital city where a typical outer suburban house costs more than an inner suburban apartment.
A study of dwelling costs by the National Housing Supply Council found it cost $561,000 to deliver a typical three bedroom house and land package on Sydney’s fringe in 2010. That’s considerably more than the $370-384,000 it cost in the other capital cities.
The cost of raw land was $152,000 on average, compared to $50-54,000 in the other cities. Further, developer contributions were in the order of $60,000 per lot higher in Sydney than elsewhere.
What’s especially important though is that the fringe house in Sydney cost slightly more than the $554,000 it cost to build a typical two bedroom apartment in the inner suburbs (in a 5-8 storey block within 2-10 km of the centre).
This pattern is reversed in the other capital cities – in their case the typical inner suburban apartment cost 25%-42% more to build than the typical fringe house. In Melbourne, for example, the house cost $115,000 less to develop than the apartment. In Perth it costs $137,000 less and in Brisbane $156,000 less.
It’s no wonder a detached house on the fringe is a more attractive proposition in Melbourne, Brisbane, Perth and Adelaide; not only is it considerably larger than an apartment, it’s also substantially cheaper to build. A key challenge for these cities is to enhance housing choice by finding ways of reducing the high cost of constructing apartments.
It’s accordingly important that large inner suburban redevelopment sites like Brisbane’s Eagle Farm and Doomben racecourses and Melbourne’s Flemington racecourse and Alphington paper mill are able to generate economies of scale and provide large additions to the supply of multi-unit housing.
In Sydney, given the fringe offers no saving in cost, it’s not surprising that a higher proportion of residents opt for greater accessibility and accordingly demand higher densities. The challenge is to address the fact that the absolute cost of building both houses and apartments is much higher than it is in the other cities.
_________________________________
- I’ve looked at the merits of Population-Weighted Density a number of times before (e.g. see Does density matter for mode share?; How many residents can our capital cities hold?; Is Los Angeles really the densest city in the US?; Does public transport use correlate with density in Australian cities?). It’s calculated as: {the sum of (the population density of each zone x the absolute population of the zone)} divided by {the sum of the absolute population of each zone}.
- It’s worth noting that, when measured in terms of the customary Average Density of urbanised area, only one of the 40 largest cities in the US is denser than Sydney (Los Angeles, although San Francisco is as dense) and only six are denser than Melbourne.


Crikey is committed to hosting lively discussions. Help us keep the conversation useful, interesting and welcoming. We aim to publish comments quickly in the interest of promoting robust conversation, but we’re a small team and we deploy filters to protect against legal risk. Occasionally your comment may be held up while we review, but we’re working as fast as we can to keep the conversation rolling.
The Crikey comment section is members-only content. Please subscribe to leave a comment.
The Crikey comment section is members-only content. Please login to leave a comment.