I’ve looked at the arguments for and against Australia’s various State laws mandating the use of helmets by cyclists a number of times before.
For example, I’ve analysed ‘before and after’ studies done in NSW and Victoria at the time the law was introduced in the early 1990s (e.g. here and here). I’ve also looked at injury studies (e.g. see here) and at a study of whether drivers treat helmeted cyclists differently (see here).
One piece of evidence I haven’t examined yet is Census data on cycling’s share of the journey to work. Opponents of the helmet law reckon that commuting by bicycle took a big hit when the law came into force.
I’ll look at that now but it’s important to understand at the outset that the journey to work only accounts for around one fifth of all trips. Nevertheless, it’s the trip purpose that’s proving most attractive for cycling in Australia at the present time.
The Census has limitations too. In particular, it provides a ‘snapshot’ of travel on just one day every five years; that creates a problem because cycling is sensitive to weather conditions. Even so, it’s the most reliable data we have.
The mandatory helmet law took effect prior to the 1991 Census in Victoria, NSW, SA and Qld and just after it in WA, NT and the ACT (1). While I say “law” for convenience, each jurisdiction passed its own law.
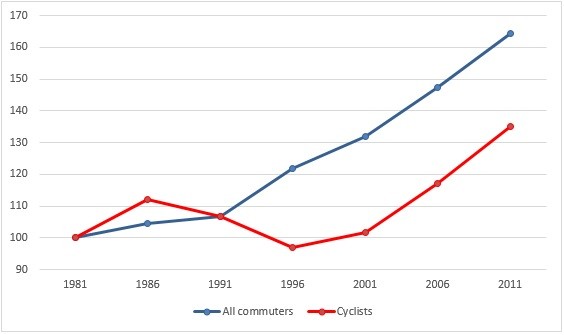
The first exhibit shows an index of the change in the number of cyclists travelling to work relative to all commuters in Australia over the period starting from 1981 and ending in 2011.
This is pretty strong prima facie evidence that the helmet law had an effect on commuting. The finding is reinforced when it’s broken down by State and compared against the date of introduction of the law in each one. There’s a consistent and highly suggestive pattern (2).
Still, there are a number of points to take into account when assessing whether or not the helmet law is currently a significant deterrent to cycling.
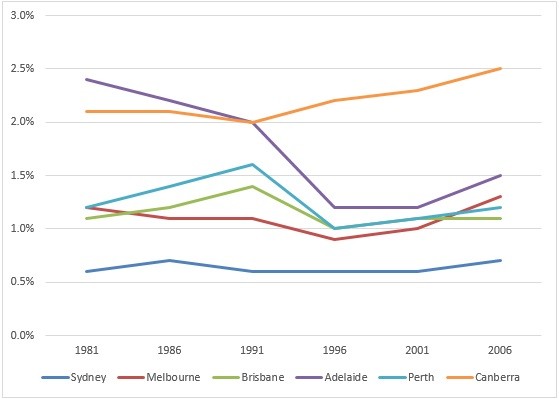
First, when examined at the capital city level, the negative effect of the law is still there but it’s not as consistent as it is at the state level. The second exhibit is based on an analysis by Mees, Sorupia and Stone and shows the change in mode share of cycling between 1986 and 2006.
Although the law was introduced prior to the 1991 Census in Sydney and Melbourne, the change in mode share over 1986-1991 in these cities was relatively small. Adelaide and Perth both suffered drops in the following Census but Brisbane and Canberra (ACT) experienced an increase.
Second, the two exhibits highlight a very important point – most commuting by bicycle in the 80s and 90s was in regional areas. For example, Sydney accounted for 77% of commuting by all modes in NSW in 1986, but only 49% of commuting by bicycle. The respective figures for Brisbane vs Qld were 52% and 26%.
High levels of cycling in the past in regional centres like Grafton and Bundaberg were driven by an entirely different demographic relative to today’s cyclists. Riders were largely blue collar workers; many were employed in regional manufacturing industries like food processing.
These industries are now much diminished, reflecting the general decline of manufacturing and the drift of population to the capitals and larger regional centres. This is a group that has largely vanished and in any event had different values to the professional urban demographic that shows the most interest in cycling today.
Cycling to work in the capitals at that time was also primarily a suburban blue collar activity. Cyclists who rode to work in the city centre were a rare sight up until the late 90s at least.
Third, the reduction in the number of cycling commuters following the helmet law was very small.
In 1986 only 18,851 NSW workers commuted by bicycle out of 1,735,415 who went to work on Census day. At the 1991 Census (seven months after the law took effect), the number of cyclists had fallen marginally to 16,970 and at the 1996 Census it was 17,305 (3).
Even if it’s assumed all the reduction can be sheeted home to the helmet law, it’s a state-wide reduction of 1,880 over 1986-1991, or 1,546 over the ten years from 1986 to 1996. In the context of the total number of commuters who cycled back in the day it’s very modest; in the context of all commuters it’s negligible (4) (5).
So all in all it’s reasonable to conclude the helmet law reduced cycling’s share of commuting to some extent, especially in regional areas. However the numbers were small.
More importantly, it’s not at all clear that well educated urban professionals – who’re the most plausible immediate source of growth in cycling today – view the lack of helmet choice with the same distaste as (some of) the predominantly male, regional blue collar workers evidently did in the late 1980s and early 1990s.
In the longer term, for cycling to increase its commuting mode share to the levels seen in some European countries, it will be necessary to appeal to a broader cross-section of the population. That doesn’t mean though that hostility to compulsory helmets is widespread.
Much else has changed in the decades since the law took effect. For one thing, the functional design and fashionableness of helmets has improved enormously compared to the Rosebank Stackhat of yore. Cycling has increased its mainstream appeal as a recreational activity too, with high-profile figures like Cadel Evans always seen wearing lycra and a helmet.
The key point though is that the kind of people who cycle to work has changed.
Update – see follow-up article: The helmet law and commuting in Sydney and Melbourne.
_________________________________________
- The 1991 Census was conducted in August. The helmet law took effect in Victoria in July 1990; NSW Jan 1991 (adults); Tasmania Jan 1991; Qld July 1991; SA July 1991; WA Jan 1992; NT Jan 1992; ACT July 1992.
- One issue I’m not sure about is the sustained upturn in total commuting from 1991 onwards. Assuming it’s not some artifact of the Census process, if it were due to growth in workers who weren’t disposed to cycling (e.g. migrants, women), it could help explain why cycling hasn’t increased its mode share since 1991.
- In Sydney, 9,265 commuters cycled in 1986 out of 1,339,533 workers who went to work on Census Day. The number of cyclists was 8,934 in 1991 and 8,193 in 1996.
- The total number of commuters in NSW increased by 36,299 over 1986-91, or by 2%. Had cycling experienced the same growth rate, there would’ve been an additional 394 cyclists added between 1986 and 1991 (whereas there was a drop of 328).
- The number of cyclists who commuted in Melbourne in 1986 was 13,062 and total commuters was 1,136,322. By 1996 (13 months after the law was introduced) the number of cyclists was 12,068, a drop of just 996. Note that numbers had already fallen by 766 between 1981 and 1986 i.e. many years before the law.


Crikey is committed to hosting lively discussions. Help us keep the conversation useful, interesting and welcoming. We aim to publish comments quickly in the interest of promoting robust conversation, but we’re a small team and we deploy filters to protect against legal risk. Occasionally your comment may be held up while we review, but we’re working as fast as we can to keep the conversation rolling.
The Crikey comment section is members-only content. Please subscribe to leave a comment.
The Crikey comment section is members-only content. Please login to leave a comment.