Earlier this month the Airbus vice president product safety operations, Michel Guerard, chaired a media discussion of a company commissioned analysis of air crash statistics that may make them more relevant to the public interest.
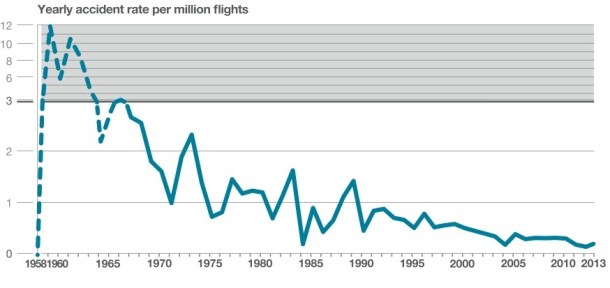
It identified two key statistics, fatal accidents and hull losses per million flights per year, or per their ten year rolling averages, that reflect the core safety performance of mass air transport.
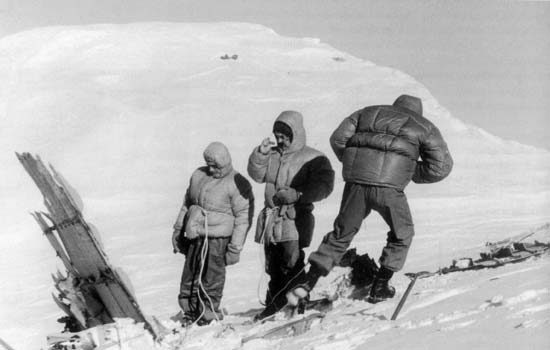
Their general acceptance would end such anomalies as Concorde having been considered the world’s safest as well as fastest jet in service right up to when one of 13 of operational status crashed, thus simplistically causing it be described as the world’s least safe jet airliner at any speed.
(This is not to diminish in any way the awful tragedy of that crash near Paris Charles de Gaulle in 2000.)
The statistical approach Michel Guerard and his colleagues presented was all about focusing on the large scale measures of risk and safety performance that affect well over 95 percent of jet engine flown air travellers in the present.
The paper discussed can be found here. It makes some compelling points, especially in its assigning statistical insignifance to types of airlines that no longer collectively perform at least one million flights per year.
Such airliner types, although rarer in service by the month, are of course highly significant risk factors to those that might have to fly on them, and the more so where their remaining applications tend to be in central Africa or other parts of the world where the public administration of air safety may be compromised or nor existant.
This study by Airbus makes it easy for readers to draw their own conclusions as to geographical and administrative risk, but it doesn’t put it up in lights with flashing arrows!
The combination of older aircraft, lesser quality airport infrastructure, dubious regulatory oversight, and opportunistic corporate structures and short termism aren’t on the reports pages, but nevertheless leap off them for anyone who has to use such air services.
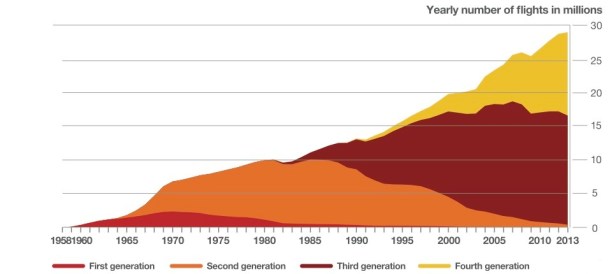
Commercial Aviation Accidents 1958-2013 A statistical analysis dates from the start of the second and enduring scheduled jet age in the western world. That is about 10 years before the number of flights operated by the world’s fleet of first generation jets like the 707s, DC-8s, Caravelles, 737s and 727s reached a million flights per year, compared to 29 million flights, in much higher average capacity aircraft, in calendar year 2013.
It excludes turbo-prop aircraft of any era, all non-western designs (from the USSR, latter day CIS and China) and crashes caused by terrorism such as 9/11, suicides, and military incidents such as the shooting down of Korean Airlines flight 007 over eastern Siberia in 2003 or the Vincennes atrocity in the Straits of Hormuz in 1988. Corporate jet accidents are also excluded.
It thus leaves out all of the major fatal air crashes that have occurred since 1958 in Australia, where no lives have been lost in a jet airliner, and no Australian registered or operated jet type has become a hull loss.
The loss of an airliner, like Malaysia Airlines flight MH370 this year, is quarantined as ‘unknown’ when it comes to causes, for later inclusion or exclusion dependiong on whether it is proven to have been the result of criminal or terrorist activity.
In 2013 there were six fatal accidents within the scope of the analysis within 29 million scheduled flights, or a rate of 0.21 such accidents involving at least one fatality per one million sectors.
The same year there were 14 hull losses, or the the scrapping or destruction of an airliner at a rate of 0.48 per million flights. Hull losses do not necessarily involve fatalities. The older the aircraft the more likely it is that it will be written off instead of repaired.
The analysis divides the jet airlines used since 1958 into four generations of increasing competency in terms of reliability of design and inbuilt safety protections. The world of air transport today is dominated by third generation jets like the Boeing 737-300s and up, 767s, 747-400s (and even the 748), F100s and MD-11s, or fourth generation jets, including all current Airbus designs, all 777s, all 787s and the Embraer E-jets.
The fourth generations jets all use flight envelope protection systems.
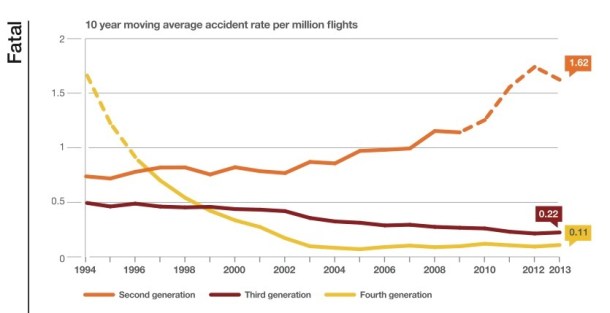
It is telling that according to ICAO and other industry data bases, the 10 year rolling average for fatal accidents per million flights during the 20 years since 1994 for third generation airlines is double that of the fourth generation jets, that is 0.22 for the former versus 0.11.
However in that same period the ten year average for second generation jets has soared to to 1.62 fatal accidents per million flights, even though the amount of flying done by those much older aircraft has fortunately fallen. (Which means, avoid flying in such older jets as F-28s, DC-9s or 747s earlier than -400s, or 737-200s if you can.)
The analysis shows that the three major causes of fatal air crashes are controlled flight into terrain, loss of control, and runway ‘excursions’ or over runs. However while the first two causes have dropped markedly this century, aircraft killing people by running off the runway, sometimes into buildings, has become the major cause of hull losses as well as sometimes causing many fatalities.
The report says that new technology aimed at preventing over runs has not achieved enough uptake to affect the statistics at this stage.
For the lay reader the message in the analysis is clear. The latest, fourth generation of jets are the safest on official statistics, and the previous third generation, while safe, is measurably less safe from a statistical perspective.


Crikey is committed to hosting lively discussions. Help us keep the conversation useful, interesting and welcoming. We aim to publish comments quickly in the interest of promoting robust conversation, but we’re a small team and we deploy filters to protect against legal risk. Occasionally your comment may be held up while we review, but we’re working as fast as we can to keep the conversation rolling.
The Crikey comment section is members-only content. Please subscribe to leave a comment.
The Crikey comment section is members-only content. Please login to leave a comment.