The Turnbull government is ending the year strongly, with Australians more optimistic about 2016, but the performance of Treasurer Scott Morrison remains a big question mark for voters, today’s final Essential Report of the year shows.
The Coalition has moved up a point on its primary vote to 45%, while both Labor and the Greens are down a point to 35% and 10% respectively, for a two-party preferred Coalition lead of 52%-48%.
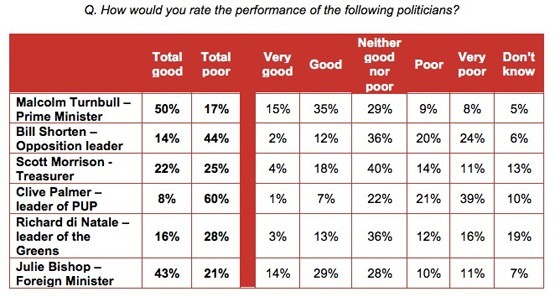
On Malcolm Turnbull’s performance, 15% of voters rate him as “very good” and 35% rate him as “good”, while only 2% of voters rate Bill Shorten’s performance as “very good” and just 12% as “good”. Over 40% of voters rate Shorten’s performance as “poor” or very poor” — with just under a quarter of voters in the latter category. Scott Morrison also fares poorly: 4% rate his performance as “very good” and 18% as “good” while 25% of voters rate his performance as “poor” or “very poor”.
Voters are slightly more positive about 2015 than they were about 2014 or 2013 — 23% say it was a “very good” or “good” year for the economy while 34% say it was “poor” or very “poor” — a net score of -11, slightly better than for 2013 or 2014. A net 41% of voters say 2015 was poor for Australian politics in general — but that’s better than the -62 and -53 of the last two years. The only worse score was whether it had been a good or a bad year for trade unions, with a net score of -27. And 40% of voters say the year was good for them and their families, compared to 19% who say it was poor — well up on last year’s 3 point net score.
Moreover, voters believe 2016 will be an improvement: voters think 2016 will be a good year economically by a net 2 points compared to -10 in both 2013 and 2014. They also expect much better things political (-5, down from -29 in 2014), they’re more optimistic about things for “the average Australian (-2, down from -17), and definitely for themselves and their families (28, up from 10 last year).
The figures between 2013 and 2014 vary depending on the category, but when it comes to things that affect them, voters definitely seem more positive than they were at the end of a catastrophic year for the Abbott government in 2014, which left political and economic sentiment in the gutter.
However, Malcolm Turnbull’s appointment of former treasurer Joe Hockey to the ambassadorship to Washington DC has left voters unenthused — 42% oppose it, including 21% who strongly oppose it, while 33% support it — mainly Coalition voters, who back it 57% to 23%.
And in an illustration the precarious position the government’s fiscal travails have left it in, 26% of voters say they are very concerned and a further 39% say they are somewhat concerned about the current level of government spending — although Coalition voters are almost insouciant about the record levels of spending under the current government, even after it was pointed out to respondents that the government is currently spending more as a proportion of GDP than the Rudd government. Just 17% of Coalition voters say they are very concerned about the level of spending compared to 32% and 34% respectively of Labor and Greens voters.
Indeed as is well established, partisanship strongly influences economic perceptions. Treasurer Scott Morrison recently admitted the government had been spending 26.2% of GDP, a higher figure than any time under the previous Labor government. But 21% of voters believe the government is spending less than Labor, including 33% of Liberal voters, compared to 13% of Labor voters and 15% of Greens voters. Only 22% accurately responded that the government is spending more than its predecessor — including 12% of Coalition voters.
Whether today’s Mid Year Economic and Fiscal Outlook changes those perceptions, or whether that gets swamped by Christmas and the summer break, won’t be clear until next year.
As for Christmas itself, it seems we’re something of a nation of Scrooges: only 36% of voters say they enjoy Christmas a lot, although 44% admitted to enjoying “some” things about Christmas; 6% of voters said they didn’t enjoy Christmas at all; another 12% said they didn’t care one way or the other. And in figures to encourage stereotypes about Greens voters, they’re the biggest Yuletide curmudgeons: 12% of Greens voters say they don’t like Christmas at all compared to 4% of Coalition voters and 7% of Labor voters, while only 32% of Greens voters said they liked Christmas a lot, while women said they enjoyed Christmas more than men (40% to 32%).

And a final Christmas question: 80% of Australians who have children admit to encouraging them to believe in Santa Claus, while 16% didn’t. And yes, Greens voters tail the field on that too: just 68% of Greens voters encouraged their children to believe in Santa, compared to 85% of Labor voters and 81% of Coalition voters. What colour was the Grinch, again?


The Crikey Commissariat is indeed short on Santa’s lists when you have to take comfort from the fact that most voters aren’t happy about Joe’s appointment. Of course Australian Citizens are unhappy about Politicians always on the lookout for new and bigger troughs into which they can stick their snouts; but the present you didn’t wish to receive was the news that in light of the low views we have about Politicians, Joe’s appointment received reasonable acceptance.
I imagine Greens voters’ relative dislike for Xmas correlates to their more independent-minded stance on mainstream matters; ie what they dislike is the commercialised nature of the event and the pressure to take part in a strictly prescribed manner. Sounds like a praiseworthy attitude to me.