In the early 1970s, federal government expenses were less than 20% of GDP, but that was a different era and only very few want to return there. For better or worse, our society is more complex and the expectations of the community have increased. There is a case that we are moving towards a new era largely driven by the baby boomers (of which I am one) moving out of the full-time workforce but still expecting access to key services that can only be provided by the government, each iteration of which needs to perform a careful budgetary balancing act.
So, what’s the best way to walk that tightrope?
It is commonly said that the federal budget represents the policy priorities of the government of the day. However, most governments must constrain their preferred policy options due to political and fiscal limits. The experience over the past 10 years is that the change in priorities is clear but probably much less than the politicians would have you believe. They prefer to present their differences as stark when, in truth, they are playing at the margins when it comes to spending. This reflects the fact that much of the budget is bipartisan or, at least, part of the furniture. Real budget reform would involve such a change in priorities that it is not politically feasible, regardless of the role of so-called populist crossbenchers.
The media, and politicians, tend to focus on funding at the portfolio level or at the program level. Typically, you see reference to branded programs such as Family Tax Benefit, income support for seniors or government schools funding. However, these not only change over time, but they don’t tell the full story for the targeted group. We also know only too well that portfolios and their names change at the whim of the prime minister. Together this makes it difficult to make like-for-like comparisons over time.
However, the budget papers include tables showing budget expenditure for different types of purpose or functions. These are published in the Statement of Budget Paper 1. These don’t get much coverage in the budgetary comment but they tell an interesting story. Unfortunately, I can only go back to 2006 for this analysis, as the Department of Finance does not revise data at the function or sub-function level when adjustments are made to historical data. Maybe that is something they could address — in order to assist in better understanding of the budget.
The functional tables allow analyses of changes over time. I have expressed these as a percentage of GDP as being the best measure of how priorities are reflected in the federal budget.
There are 14 functions and each function is split in up to 12 sub-functions.
It is useful to think of the budget being divided into three:
- The big spending functions — social security and welfare, health and other purposes (mainly general purpose payments to the states and territories, public debt and public service superannuation);
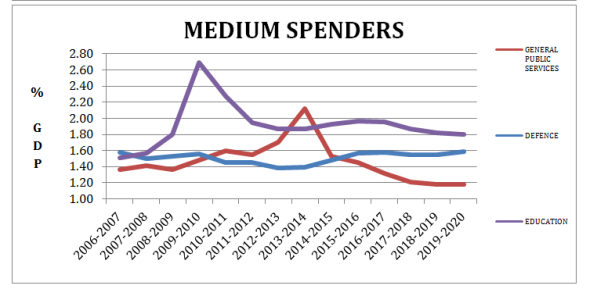
- The medium areas of spending — education, defence and general public services (including foreign aid); and
- The small spending areas — public order and safety, housing and community amenities, recreation and culture, fuel and energy, agriculture, forestry and fishing, mining, manufacturing and construction, transport and communication and other economic affairs (mainly labour market assistance, vocational education and immigration).
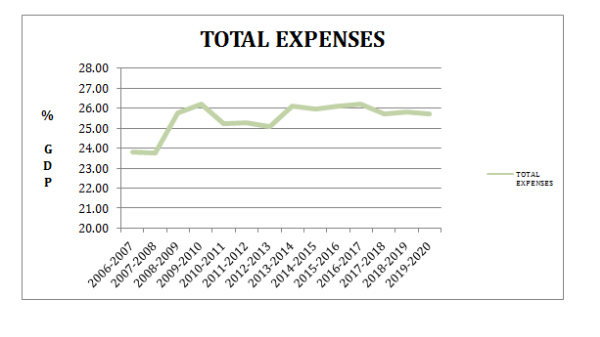
We know that total budget expenses have hovered around 24-26% of GDP since 2006 with the high point during the global financial crisis just edging out the current year without marginal reductions over the next few years.
The task of government seems mainly to have been one of moving funding around within these limits.
We see that for the big spending functions (in aggregate around 19 per cent of GDP) there has been a steady increase in allocations, as a percentage of GDP for:
- Social Security and Welfare
- mainly due to assistance to the aged and assistance to people with disabilities with other components such as assistance to the unemployed, assistance for indigenous Australians and assistance to veterans either flat or decreasing;
- while assistance to families with children decreased significantly.
- Other Purposes
- mainly showing an increase in public debt interest while other elements were relatively flat.
However, the health function has been surprisingly flat over that period with small increases in medical services and benefits, and assistance to the states for public hospitals partially offset by decreases in pharmaceutical benefits and services.
My takeout from this is that there is little or no desire in either the cabinet or the wider community to make significant inroads in reducing expenses in these functions with the exception of public debt interest, which is a function of our ability to reduce the deficits and move into surplus. While they may chip away at the edge by changing programs at the functional and even the sub-functional level, nothing much really changes.
So, if the big spenders appear to be locked in to grow, what about the medium spenders (currently around only 5% of GDP in aggregate)? They are a mixed bag.

- General public services (which includes foreign aid) is decreasing rapidly while education has increased over the last decade but is now flattening out while defence is relatively flat.
- Within education, schools funding has been increasing from 0.8 to 1.0% of GDP while higher education is decreasing slightly back to the level it was in 2006. Other elements are all relatively flat.
Again, I can’t quite see how these functions can be significantly reduced without major push-back.
So that leaves us with the tiddlers that, in aggregate, represent less than 2% of GDP. Of course, this includes functions such as transport and communication, yet many commentators argue we need more infrastructure to support a growing population and economy. Spending on this function has been volatile over the past 10 years (mainly in relation to road funding).
Currently this function is 0.65% of GDP and is forecast to decrease to 0.27% in 2019-20. Therefore, there is a case that sensible investments need to be made on infrastructure so while one can argue that spending on energy subsidies, recreation and culture pursuits, etc, could be cut, it is unlikely to have any meaningful impact on the budget and risks destroying the general understanding that all elements of the community need sensible support for activities with a large public good purpose.
I suppose this analysis puts me firmly in the camp of those arguing that we need to reset our fiscal strategy to the reality that total expenses will stay at or above 26% of GDP. It is the new black.
 This wave may last for another 20 years and expenses may go back to lower levels. It is hard to see that there is a case for drastically reducing the total budget expenses to accommodate a demographic bump when it will clearly have an adverse impact and is unlikely to be supported by the overall taxpaying community.
A better course is to continue the usual tinkering with expenses but find the bulk of the necessary funds through giving the taxation side of the budget, including tax expenditures, greater scrutiny.
*Dr Greg Feeney recently left the Australian Public Service after a long career working as a senior executive in many areas of public policy including Transport and Finance.


With an aging population living longer there is a huge well-experienced potential workforce not being well used. Many retired and most unemployed people still want to be useful to society. Where are the structures that support that? Who provides the organisational structure, for example, to make use of back gardens of the houses of elderly people – growing food to be shared between the owner and the workers? The local council could do that.
Where are the street support groups organising regular visits to the house-bound? Why does not the Families department organise that?
Etc. Skills and capacity are going begging while the potential providers are left on the shelf.
Hooray! Finally someone argues for increasing Australia’s taxes. Now to notice that Australia is the 5th lowest taxing country in the Oecd.