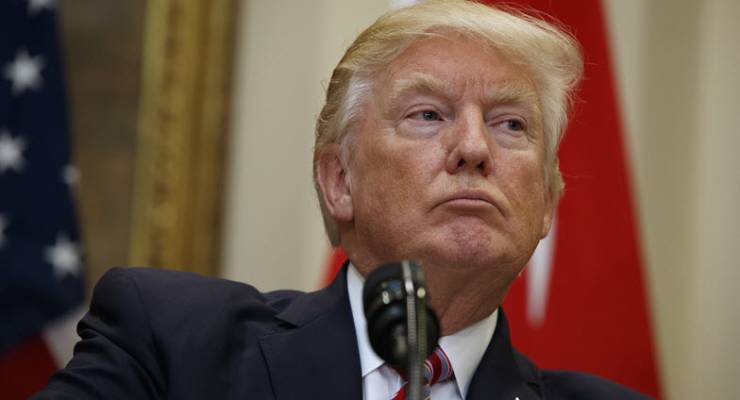
Close observers of the US economy got a bit of a shock last week when federal debt broke through US$20.5 trillion. The amount added in November’s first fortnight was a staggering $64.8 billion. That’s more than the entire debt New Zealand has accumulated since World War II. In two weeks.
Ballooning debt
In the last three months, from August 17 to November 17, a thumping $689 billion has been added to US debt — more than the entire gross domestic product of Saudi Arabia or Switzerland or Argentina.
Reasons for the blow-out can be found in Treasury’s monthly numbers for income and outlays. For the year to July 2017, total federal income was up 4.5% on the same period the year before. But quite suddenly, over the last two months for which data is available — August and September — income has plummeted.
For August and September this year, total revenue was just $575.03 billion, down $12.92 billion (or 2.2%) on the same two months last year.
With a roaring stock exchange, robust corporate profits and jobs growing steadily, this strongly suggests rampant company tax evasion.
Government spending
Spending is also well ahead of budget — with one month to report before the end of the fiscal year. Outlays to the end of September were 3.3% above the same period last year.
The breakdown of these grand totals is quite illuminating. Individual income taxes collected are 2.7% higher than last year; corporate taxes collected are 0.8% lower. Anyone surprised?
Spending on defence, homeland security, the president’s office, capitol police and interest on the gross debt are all up on last year’s levels. Outlays on environmental protection, agriculture department research and education, substance abuse and mental health services, student financial assistance and tax collection enforcement are all down.
Tanking trade
The neat strategy presidential candidate Trump promised to implement to reduce the debt — “I think I could do it fairly quickly” — was fixing trade agreements:
“I’m renegotiating all of our deals, Bob [Woodward]. The big trade deals that we’re doing so badly on … We’re losing with everybody.”
So far, this is an area of conspicuous failure. Over the last six months, the US trade deficit has averaged $44.5 billion per month. Over the same period last year, it was just $40.8 billion. In 2015, it was $41.6 billion. Clearly heading the wrong way.
US dollar
Equally worrying is the dive in the dollar’s value. It now equals 84.8 euro cents, down from 96 cents in January. It is worth 75.7 UK pence, down from 82 pence in January. It has also fallen this year against the Chinese yuan, the Canadian dollar, the Swiss franc, the Mexican peso and even the Aussie dollar.
Personal savings and debt
Savings by Americans has collapsed dramatically this year and household debt has increased. From savings of $554.6 billion in this year’s first quarter this fell to $545.6 billion in the second quarter 2017. It has fallen further in the third quarter, to $494.8 billion, the lowest level since the third quarter of 2008, at the depths of the great recession.
Interest payments on personal debt broke the $300 billion barrier the June quarter to $300.7 billion; it remained at $299.6 bn in the September quarter. That compares with $279.3 bn in the same quarter last year and just $271.2 bn in 2015.
Among the few pluses, recent improved indicators include:
Economic growth
The US economy grew at an annualized rate of 3.0% in the third quarter of 2017 just a touch below the 3.1% in the second, for a current annual rate of 2.3%. Although improving, this still ranks only 24th among the 35 rich developed countries comprising the OECD. Well ahead of Greece, Mexico and Australia, however.
Employment
Job numbers and participation continue the positive trends of recent years. In October the jobless rate fell to a creditable 4.1%, now ranking equal eighth in the OECD. So will it drop below 4.0% as happened in the late Bill Clinton years?
The participation rate increased steadily from 62.7% in May this year to 63.1% in September. It has just wobbled a bit in October, slipping back to 62.7%. Next month will confirm whether this is a blip or a new trend.
The main employment worry is average weekly hours, which seem stuck at 34.4 hours. This is below the average of 34.52 in 2015 and 34.50 in 2014. Given global conditions, this is not good.
Trump was elected on the promise of making America great again. So far, he appears to be making life great for the very rich minority, but not so much for the majority.


“In October the jobless rate fell to a creditable 4.1%, now ranking equal eighth in the OECD. So will it drop below 4.0% as happened in the late Bill Clinton years?”
Smoke and mirrors, like most Western economies – if the figures are too high, just change the goal posts so they look better! The real unemployment rate, as they used to measure it, would be nearer 25-27%!
Interesting claim. Do you have any references for it?
As always, this author just goes to the heart of the matter – numbers.
Bang. Done.
Next!