The claim
Australia’s recently-appointed Assistant Minister for Community Housing, Homelessness and Community Services Luke Howarth has identified emergency accommodation as the Government’s priority for tackling homelessness in Australia, despite calls from lord mayors and advocacy groups for a focus on one of the causes of the problem: housing affordability.
Chief executive of advocacy group National Shelter, Adrian Pisarski, told RN Breakfast that while there is a need for more emergency accommodation, systemic issues in the housing market must also be addressed.
“We have a very deep and severe housing problem in Australia, and it is the social housing end of it that we have been missing out on.”
“We have dropped our social housing levels from a high in 1991 of 7.1% to a low now of 4.2% and falling,” Mr Pisarski said.
“If we don’t address the problems in the housing system, we will never solve homelessness.”
Have social housing levels in Australia dropped from a high of 7.1% in 1991 to a low of 4.2% today?
RMIT ABC Fact Check investigates.
The verdict
Mr Pisarski’s claim is in the ballpark.
There are multiple ways of measuring social housing levels in Australia.
Fact Check examined data published by federal government agencies the Australian Institute of Health and Welfare, the Productivity Commission, and the Australian Bureau of Statistics, as well the Australian Housing and Urban Research Institute and other sources.
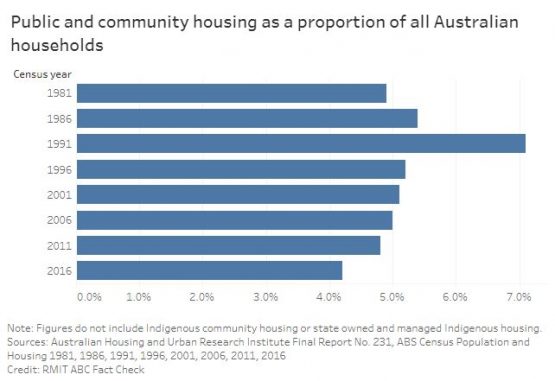
Mr Pisarski quoted data published by the Australian Housing and Urban Research Institute which shows public and community housing as a proportion of all Australian households was 7.1% in 1991, and 4.2% in 2016.
The figure of 7.1% is higher than census data and other estimates for that year.
The latest AIHW data, which includes all four main types of social housing and is drawn from state and territory government administrative data, shows that in 2017-18, there were 4.6 social housing dwellings per 100 households in Australia.
The Commonwealth Government first granted funding to the states for the provision of housing in 1945.
While making comparisons across the decades is difficult, the body of data suggests the early ’90s was a high point for social housing levels in Australia, and that the levels now are historically low.
What is social housing?
Social housing is rental housing that is funded or partly funded by government, and owned or managed by the Government or a not-for-profit or non-government organisation.
It is set aside for Australians who have difficulty accessing housing in the private market.
This includes people who are homeless or at imminent risk of becoming homeless, people living with a disability, those experiencing family and domestic violence, low-income families and Indigenous households.
Tenants in social housing pay rent that is lower than market value, with the remainder subsidised.
Commonwealth funding for social housing is provided to state and territory governments through the National Housing and Homelessness Agreement, with state and territory governments given primary responsibility for delivering the services.
The term “social housing” includes four main types of accommodation:
- Public housing: dwellings owned (or leased) and managed by state and territory housing authorities.
- State owned and managed Indigenous housing: dwellings owned and managed by state and territory housing authorities that are allocated only to Aboriginal and Torres Strait Islander tenants, including dwellings managed by government Indigenous housing agencies.
- Community housing: rental housing managed by community-based organisations that lease properties from government or receive some form of government funding (though some are entirely self-funded).
- Indigenous community housing: dwellings owned or leased and managed by Indigenous organisations and community councils. These can also include dwellings funded or managed by government.
According to the Australian Institute of Health and Welfare, in 2017-18 more than 800,000 Australians lived in social housing, in more than 400,000 dwellings across the country.
The majority — 72% — lived in government owned and managed public housing, while 20% lived in community housing, 4% in Indigenous community housing and 3% in state owned and managed Indigenous housing. (Total equals 99% due to rounding).
Assessing the claim
Social housing levels can be measured in a number of ways. A couple of definitions you’ll need to know:
- A social housing “household” can be a single person, or a group of two or more people who usually reside in the same dwelling and share the cost of food and other living essentials.
- A “dwelling” is the structure, or space within a structure, where the person or group of people live — whether a house, unit or apartment, caravan or tent.
Fact Check examined figures from a range of official sources, focusing on social housing households and dwellings measured as a proportion of total households and occupied private dwellings in Australia, rather than raw numbers, to account for population growth.
The Commonwealth Government first granted funding to the states for the provision of housing in 1945.
However, census counts of government tenancies were first published in the 1954 census, so Fact Check has taken that as the starting point for assessing the high and low elements of the claim.
Australian Institute of Health and Welfare data
The AIHW (a federal government agency) publishes social housing statistics drawn from administrative data provided by state and territory governments.
The data includes public and community housing, as well as Indigenous community housing and state owned and managed Indigenous housing.
The latest publicly available AIHW data shows that in 2017-18, there were 4.6 social housing dwellings for every 100 households in Australia.
This was a drop from 5.1% in 2007-08 (the earliest publicly available data in this series).
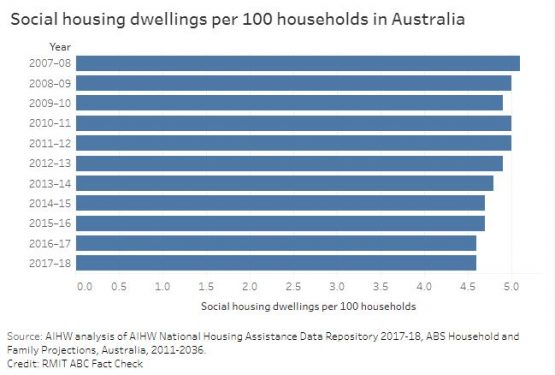
While the AIHW data can’t be used to assess the “high in 1991” aspect of the claim, it does show that social housing has fallen into the range of 4%.
Historical census data supports the narrative
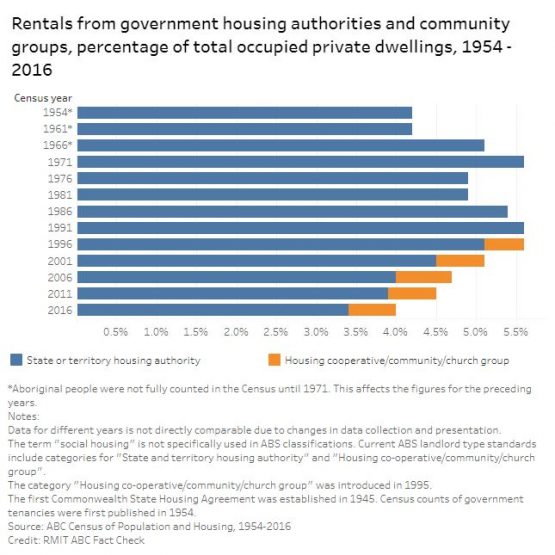
To look further back, Fact Check referred to Australian Bureau of Statistics census data from 1954, the first census to count tenants living in governmental housing, to 2016.
Changes to the scope of information collected, differences in the definitions used and presentation of the data over the decades, as well as the self-reported nature of the survey, mean it’s not a perfect measure for this purpose.
However, the data that is available does support the assertion that 1991 was a high point, and recent years a low point, for social housing levels in Australia.
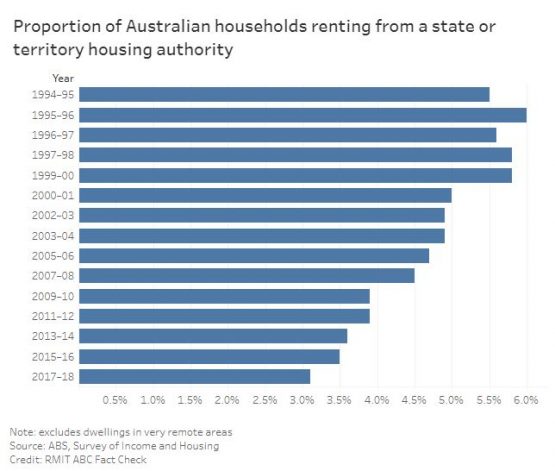
In the Survey of Income and Housing, the ABS also publishes data on the proportion of households renting from state and territory housing authorities, from a selection of 15 years between 1994–95 and 2017–18.
This data excludes public housing households in very remote areas, and doesn’t include community housing, so it is not representative of all social housing.
What the remaining data does show is a fall in the proportion of households renting from state and territory authorities, from a high of 6% in 1995-96 to a low of 3.1% in 2017-18.
Australian Housing and Urban Research Institute data
In response to Fact Check’s request for sources to support his claim, Mr Pisarski provided a 2017 research brief published by the Australian Housing and Urban Research Institute (AHURI), a national research network.
The figures, as quoted by Mr Pisarski, show public housing alone accounting for 7.1% of all households in Australia in 1991, falling to 4.2% (including both public and community housing) in 2016.
The AHURI data refers only to public and community housing, omitting Indigenous community housing and state owned and managed Indigenous community housing, which according to the AIHW accounted for around 7% of social housing in 2017-18.
The AHURI data is also based on census data, which is based on self-reported answers from householders, as opposed to AIHW and Productivity Commission data, which is drawn from government administrative data.
The figure of 7.1% was higher than the census data (at 5.6%), and experts told Fact Check it was higher than their own estimates.
Are social housing levels ‘falling’?
It is fair to say that based on the datasets presented above, there has been a continuing downward trend in social housing levels since 1991.
Judith Yates, an honorary associate in the School of Economics at the University of Sydney, told Fact Check the figures may continue to fall.
“On the basis of current household projections, it is quite possible that the estimate of 4.2% will not be the lowest point reached unless there is a dramatic reversal in the current trend of net new additions to the social housing stock,” Dr Yates said.
“Unless current social housing production increases considerably, it is reasonable to say that its share will continue to fall.”
Carmela Chivers, an associate at the Grattan Institute, told Fact Check the stock of social housing has “barely grown in 20 years, while Australia’s population has increased by 33%”.
Terry Burke, Professor of Housing Studies at Swinburne University Centre for Urban Transitions, told Fact Check the “rate of investment in social housing — as either public or community housing — hasn’t kept pace with the overall growth of population or of the total dwelling stock”.
The transfer of public housing to community housing
The decline has been particularly prominent for public housing — accommodation owned and managed by state and territory governments — over the last decade.
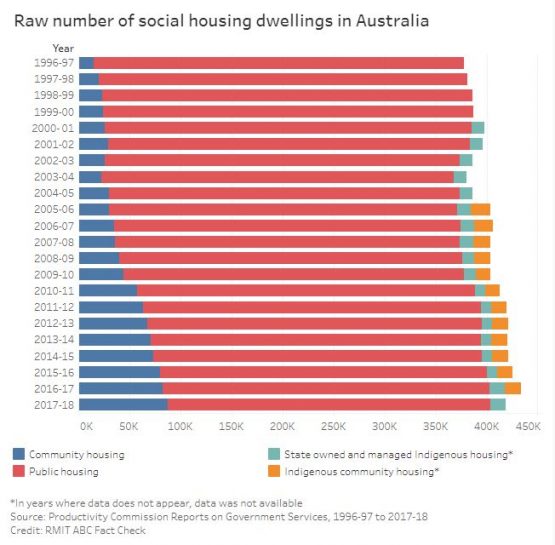
In addition to a proportional decrease, Productivity Commission data shows there has been a decrease in the raw number of public housing dwellings, from around 362,000 in 1996-97 to 316,000 in 2017-18.
Part of this decline has been offset by an increase in community housing, with the number of dwellings in that sector rising from around 15,000 in 1996-97 to around 88,000 in 2017-18.
This partly reflects the transfer of some public housing stock to the community housing sector, in line with changes in government policy, as well as new growth in community housing stock.
Professor Burke of Swinburne University told Fact Check that “community housing is now seen as the future of the social housing sector, and as such the growth sector”.
“Unlike public housing, community housing agencies can access Commonwealth Rent Assistance.”
“This means community housing agencies have a higher income stream from rent than public housing.”
Supply not keeping up with demand
As of 30 June 2018, there were more than 140,000 applicants on the waiting list for public housing, and close to 9000 applicants on the waiting list for state owned and managed Indigenous dwellings.
In June 2017, there were more than 38,000 applicants on the waiting list for mainstream community housing. Recent figures for Indigenous community housing were unavailable.
People may be on more than one waitlist, so these numbers may be an overestimate of the total.
However, the figures still suggest high numbers of Australians in need of social housing, with around 50,000 people (based on 2017 and 2018 figures) considered in “greatest need” — including people who are already homeless, at imminent risk of homelessness, or whose life or safety is at risk in their current accommodation.
Principal researcher: Natasha Grivas
Sources
- Luke Henriques-Gomes, The Guardian, Community housing minister Luke Howarth wants a ‘positive spin’ on homelessness, 9 July, 2019
- Georgia Clark, Government News, Councils demand action on housing crisis, 5 May, 2019
- Australian Human Rights Commission, Homelessness, 5 April, 2016
- Cathy Van Extel, RN Breakfast, Australian Broadcasting Corporation, Homelessness in focus as Government urged to build more social housing, 10 July, 2019
- Australian Institute of Health and Welfare, Housing Assistance, Glossary, 17 July, 2019
- Australian Institute of Health and Welfare, Housing assistance in Australia 2018, 28 June, 2018
- National Housing and Homelessness Agreement, Key Fact Sheet
- Productivity Commission, Report on Government Services 2019, Housing
- Australian Institute of Health and Welfare, Housing assistance in Australia 2019
- Greg McIntosh and Janet Phillips, Parliament of Australia, The Commonwealth-State Housing Agreement, E-Brief: issued 29 November 2001
- Australian Bureau of Statistics, Survey of Income and Housing, 4130.0 Housing Occupancy and Costs, Australia, 1994–95 to 2017–18
- Australian Housing and Urban Research Institute, AHURI Brief, Census data shows falling proportion of households in social housing, 16 August, 2017
- Lucy Groenhart, Terry Burke and Liss Ralston, Australian Housing and Urban Research Institute, Thirty years of public housing supply and consumption: 1981–2011, October 2014
- Productivity Commission, Reports on Government Services, Housing, 1995 to 2019
- Productivity Commission Research Paper: Housing Assistance and Employment in Australia, Volume 2: background papers, April 2015
- 2016 Census Community Profiles, Occupied private dwellings by ‘Tenure and Landlord Type’ including ‘State or territory housing authority’ and ‘Housing co-operative/community/church group’, Time Series Profile, Table 18
- 2006 Census Community Profiles, Occupied private dwellings by ‘Tenure and Landlord Type’ including ‘State or territory housing authority’ and ‘Housing co-operative/community/church group’, 2006 Time Series Profile, Table 16
- Census of Population and Housing, 1991, Occupied private dwellings by ‘Tenure and Landlord Type’ including ‘State/Territory housing authority’, 2001 Time Series Profile, Table 19
- Census of Population and Housing, 1986, Households by ‘Nature of Occupancy’ including ‘Housing authority’, Population and Dwelling Summary, Table C38
- Census of Population and Housing, 1981, Households by ‘Nature of Occupancy’ including ‘Tenant – Housing authority’, Population and Dwelling Summary, Table 32
- Census of Population and Housing, 1976, Private dwellings by ‘Nature of Occupancy’ including ‘Housing Commission’, Population and Dwelling Summary, Table 54
- Census of Population and Housing, 1971, Private dwellings by ‘Nature of Occupancy’ including ‘Tenant of Government’, Bulletin 2, Part 9, Table 5
- Census of Population and Housing, 1966, Occupied private dwellings by ‘Nature of Occupancy’ including ‘Tenant of Government Authority’, Volume 3 – Housing, Table 14
- Census of the Commonwealth of Australia, 1961, Occupied private dwellings by ‘Nature of Occupancy’ including ‘Tenant (Governmental Housing)’, Summary of Dwellings, Table 6
- Census of the Commonwealth of Australia, 1954, Occupied private dwellings by ‘Nature of Occupancy’ including ‘Tenant (Governmental Housing)’, Characteristics of Dwellings, Table 15
- John Daley and Brendan Coates, Grattan Institute, Housing affordability: re-imagining the Australian dream, March 2018
- Matthew Thomas, Parliamentary Library, Parliament of Australia, Social housing and homelessness, May 2017
- Australian Government: National Housing Supply Council, State of Supply Report, 2009
- Australian Government, Productivity Commission, Housing Assistance and Employment in Australia, Research Paper Volume 2: Background Papers, April 2015


Appalling situation…perhaps the feds/states should just build a lot of public dwellings quickly, to improve both the social and economic outlook for all people. And stop importing more and more people into this country without adequate planning to accommodate them all. At the very least, let’s have a ‘catch up’ period of a few years.
Forget other infrastructure…a short waiting time on transport and roads doesn’t sound too bad, when you have over 100,000 people, including children, at risk on the streets with little chance of ever achieving a ‘roof over their heads’. Not to mention some very poor Newstart recipients, who don’t have any choices at all.
Useless bloody governments, the lot of them!!
Our miraculous Leader has confirmed that there will be no further reduction of immigration from the, current – allegedly, rate of 160K pa.
That logic suggests that there will be a miraculous appearance of 100K dwellings per year above the usual.
Oh, and don’t forget the dodgy visa scammers, they need accommodation also.
Round it off to 200K new homes per year? Think of the construction boom!
Think of the import bill since we make bugger all in this country in the way of household goods.
Am I missing something?
A hidden problem and growing is over crowding within existing housing stock as those on low incomes are obliged to share housing costs to get a roof over their heads. Inadequate or no housing at all is a prime cause of social distress expressed in many ways that all add to both individual and societal disfunction.