As Crikey reported at the end of January, Australia is collapsing around its edges.
Hundreds of beaches — and the communities, landscapes and infrastructure attached to them — are under imminent threat from accelerating erosion.
We reported that climate change, in the form of rising sea levels and more extreme weather events, was going to make this worse.
What we didn’t know at the time was that a case study was so close on the horizon.

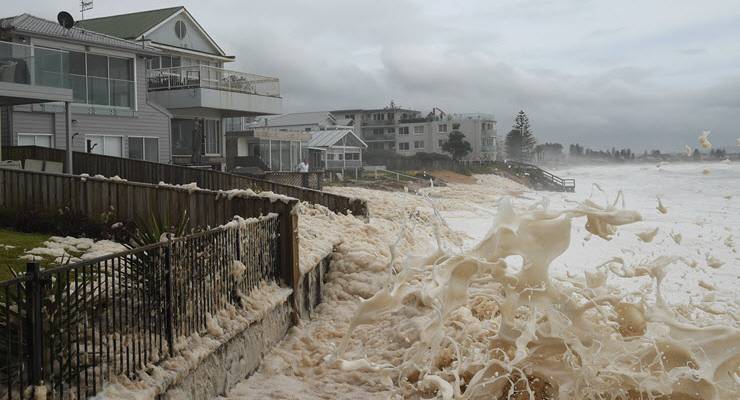
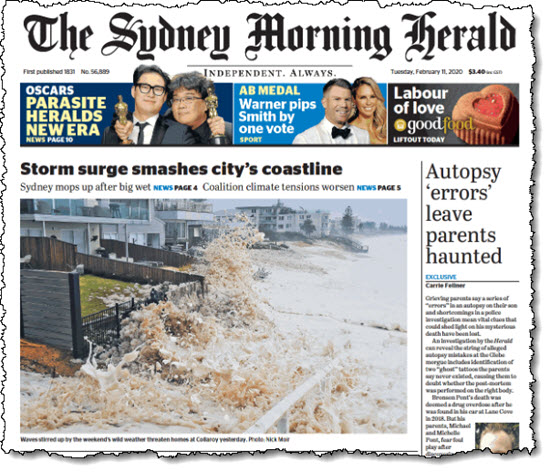
Alongside the heavy rain in New South Wales over the past few days — which extinguished fires that had been raging in that state for nearly three months, just in case you weren’t already getting that “end of days” vibe — parts of the coast experienced a storm surge.
Foaming six-metre waves clawed away 25m from the Collaroy-Narrabeen beach, one of Australia’s worst erosion hot spots.
University of Sydney geoscience Professor Andrew Short told Crikey the narrowed beach would be more vulnerable now if there were another storm event before the beach had time to recover.
“The worst erosion always occurs when there are a series of such events, as it usually takes more than one storm to do severe damage,” he said.
Dr Mitchell Harley, a researcher who monitors Collaroy for the University of New South Wales, said there was potentially another storm coming next weekend which was “very concerning”.
Property owners in the area — subsidised by the Northern Beaches council with help from the state government — have spent millions of dollars on sea walls to protect houses in the area.
Short said these plans would not protect the beach.
“They have started building a seawall which will protect the houses but not the beach,” he said. “The only way to have a permanent beach is beach nourishment from the huge volumes of sand that lie in deep water directly off Narrabeen-Collaroy and, for that matter, much of the Sydney coast.”
Harley said the problem with nourishment was that it still had to be “topped up every few years”.
“So you’re locking in perpetual maintenance to keep the beach at a safe width,” he said.
Amazingly, it could have been much, much worse; back in 2016, the area lost 50m in a weekend. This time the waves weren’t as high, and the wind direction was different, which pushed the worst of the erosion away from the most vulnerable areas.


Not all efforts to “save” beaches are equal. The expression “Rich Man’s Rips” describes beach modification to benefit some rich prick that destroys beaches farther along where the non-rich non-pricks live. Like a Morrison government action principle.
Anyone remember the Goldie (Gold Coast for the youngsters) in 1967?
Collapsing pools and high rises in danger.
Same beach looks pretty good now in 2020.
Suggest Collaroy rich list homeowners go buy some big rocks.
Coastal councils have known for fifty years that beach sand travels sideways and high water level travels relentlessly upwards. Council should not be protecting or permitting the building of structures that are doomed to become underwater snags for fin-de-siècle boaters and bathers. Neither should they be putting in groins to slow the passage of the beach sand here or there when the whole coastline should be accessible to beachgoers.
Than relentlessly upward travel of the high water level seems to have missed Fort Denison in Sydney harbour.
I saw 100 years of records from the same Fort Denison tide gauge published on the Engineers Australia Forum and there is no rise in sea level over the decadal averages, and the the last decade was lower than the first decade 100 years ago.
Could anyone explain how Sydney harbour manages to maroon itself from ‘climate change’ sea level rise for 100 years?
Nosliner asks, how come decadal averages of sea level in Sydney make it appear to be decreasing rather than rising? It is global sea level that is rising, averaged over many stations. It would only need an upwelling of cold water in the nearby ocean to lower its mean sea level faster than the global average has risen. In most places, the sea level is rising faster than the land is rising or sinking. And it is accelerating.
The decadal global average ending 2015 measured 3.6 mm/a, when for most of the 1900s it was 1.4 mm/a. A more pertinent question is, how come people are talking about several metres of sea level rise due to the melting of the polar glaciers when only (3.6 mm/a x 80 years=) 0.3 m to 2100 is currently being measured ?
AGW is melting and softening the polar ice, so the glaciologists warn us that this or that volume of icecap is going to slide into the sea – but can’t tell us when or how fast. The current rate of ice flow is fairly well known, however the acceleration is not. The GRACE satellite has been measuring the loss of ice since 2003. (see NASA graphs). Greenland lost 3000 Gt in the 10 years to 2013, while Antarctica lost 1000 Gt, where each 1000 Gt has become 2.8 mm of global sea level rise. Although noisy, an accelerating contribution to sea level can be picked out in both graphs as a downward curvature. Currently, Greenland is losing 286 Gt/a, Antarctica 127 Gt/a, according to NASA.