Do you want to see a graph that made my jaw hit the floor?
The Commonwealth Bank recently sent out a compendium of data on its lending activity, and it contained this startling graphic. Apparently amid the mayhem of death and economic destruction wrought by 2020, housing lending is continuing apace.
In fact, as the next graph shows, despite a dip in April and May, new lending is still almost 20% higher than last year.

“The flow of new lending is now a little above where it was pre-COVID. In annual terms lending is growing at a strong pace,” the CBA said.
The Australian housing market is astonishing. Like a cockroach, it appears capable of withstanding most anything. And goodness knows the events of 2020 have been the equivalent of a can of Mortein and a vigorous stamping.
Unemployment is at the highest level since last millennium and still rising. The economy has shrunk at a pace not seen since the 1930s. A tidal wave of business insolvencies is likely to hit in October. Airbnbs are full of dust, not tourists, and international student arrivals have stopped.
Nothing on that list looks like a good omen for housing. Also rents are falling through the floor. Over the past year, house rents are down 7.6% in Sydney, for example, and unit rents down 7.2%. Yields for property investors are looking sickly.
And yet. Australia’s love for home ownership apparently continues to burn fiercely.
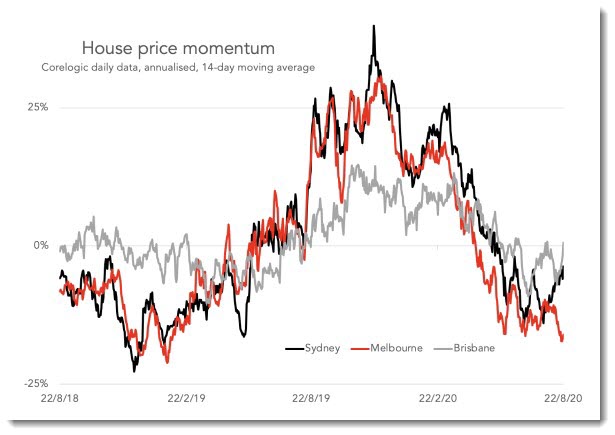
As the next graph shows, house price movements remain quite negative in Victoria. But in NSW and Queensland they appear to be clawing their way back up to positive territory. The effect of the lockdowns is wearing off.

First-home buyers are a big part of the ruckus. New lending to them is up in all states except for Victoria and the ACT. Deposits are surely easier to come by now, with spending capped by sheer virtue of a lack of spending options, higher Centrelink payments, and the option to access super.
It remains possible — not certain, but possible — that despite spectacularly elevated debt levels and very high housing prices overall in Australia, we could get through the coronavirus recession without a major housing crash. This is, after all, a very weird recession we are having. One where luxury car sales go through the roof. One where people’s total earnings are up, the US sharemarket is hitting records, and cash is piling up sky high in people’s bank accounts.
Whether you seek to assign credit or blame for this miraculous stability in the housing market, you must turn to one place. The Reserve Bank of Australia. Its interest rate cuts have been the balm the housing market wanted. By slashing the official interest rate to just 0.25%, fixed mortgage rates have fallen to as low as 2.3%.
Fixed-rate loans are surging in popularity. Australian borrowers have always been heavy users of variable rate mortgages. It’s part of the reason monetary policy in this country works quite effectively, and why we pay outsized attention to the RBA.
The average person notices a change in official interest rates in their mortgage payment. Fixed-rate loans have rarely accounted for more than 20% of loans. Now they account for 40% of CBA lending.
These low rates mean borrowers can service far higher loans. And so they are borrowing more. Average loan size is also up on last year, according to CBA data.
With the RBA pledging to leave rates at low levels for years to come, you have to wonder if big new loans will be enough to compensate for the many factors that would otherwise be pushing the housing market down.


‘Prices are holding up because people can borrow more’. That’s not what they taught when I did economics. This is a strange world.
I’m no economist, but I do have two eyeballs, so I’m going to use my decades of looking at stuff to make the following expert observation:
That ‘jaw-dropping’ graph looks a whole lot like the last 4 months (on the graph) shows that roughly the same amount of loans as usual have been granted… just in very different timings.
In effect, the 2 circa -20% months mostly cancel out the circa +30% and +10% month.
That ‘annual smoothed’ line showing above average growth post covid seems to be propped up by all those above average months of growth before covid hit from between jul 19 and when mar 20.
In effect, that annual smoothed line is accounting for 9 months of precovid lending going gangbusters and only 3 months of covid impact.
No wonder that line says growth is still way above trend even now- its 9 months vs 3, it’s nothing close to a complete data set.
The gist of the article seems to be that lending is increasing despite covid- unless I’m mistaken that is a bit of a crock.
All that it looks like is that there was 2 months of abnormally low lending, when ~40% of usual applicants either sat on the sidelines or weren’t approved.
Then, that pent up demand was released and that circa 40% of people who sat on the sidelines went and got their loans in the following 2 months.
If my read is infact the case, it’s pretty disingenuous to write an article that makes it seem like their is MORE lending going on.
I will also add that in the ‘Crikey Daily’ email, the Editor-In-Chief, Peter Fray, describes this article as discussing ‘the surge in home lending’.
I guess the very unsexy truth of the matter, being the ‘non drop (so far) in home lending’ wasn’t going to generate all those delicious clicks fast enough.
It’s a fair reading, Damien. Seems most likely that there were two months where loans couldn’t be had because we were all locked up in our, err, homes, and that the vast imbalances already in the system have yet to experience a Covid-19 comeuppance.
Something’s got to give, surely the centre cannot hold.
One would suggest that data, perceptions and attitudes so far, on the housing market and financing, may not be indicative of the same at the end the upcoming quarter nor the new year?
In other words many Australians are blinded by constant real estate and prosperity gospel agitprop while impacts of Covid19 on the economy are yet to be experienced…..
You’re kidding right? Your jaw almost hit the floor? For many years now there’ve always been people who can (just) afford to get a loan to buy one of the limited homes or blocks available. But there are a great many who can’t.
Some years ago RP Data had figures that showed that NSW was some 200,000 private housing short of demand and I doubt those figures have changed much, so no way are prices about to fall. More recent data shows the Australian market is some 430,000 units short of demand for social housing.
Neither party is keen to upset this cosy little apple cart which serves developers and the well off multiple dwelling owners in our society so excellently.
It will be interesting to see what the drop in mass immigration & visa abuse does to housing, the most overheated market in my experience.
If the drop in rental cost is not a price signal then it’ll do until one turn up.