Two intriguing realities have been confirmed in recent days. The first is that the Morrison government and the pro-Coalition media are campaigning vigorously already on government spending. The second is that the Morrison government is Australia’s highest-spending administration on record.
Treasurer Josh Frydenberg told Sky News last week that “the Labor Party are addicted to higher spending and higher taxes. And we saw that at the last election.”
He added later, regarding Labor Leader Anthony Albanese, that “he’s addicted, as the left of the Labor Party are, to high taxes and more spending”.
Yes, we did indeed see at the last election a successful campaign depicting Labor as big taxing and big spending. But as the recent Final Budget Outcome (FBO) for 2020-21 shows clearly, that was not true in 2019, is not true now and has never been true.
The real big spenders
The highest-spending government by far, as a percentage of gross domestic product (GDP), is the Morrison government.
Table B1 of the FBO shows its annual average rate of general government payments is 26.2% of GDP, the highest since records began in 1970. The lowest-spending administration, also by a substantial margin, was the Whitlam government, at just 19.7% of GDP each year. These demonstrable facts have not hindered the Coalition and the media from mounting a highly effective operation denigrating Labor.
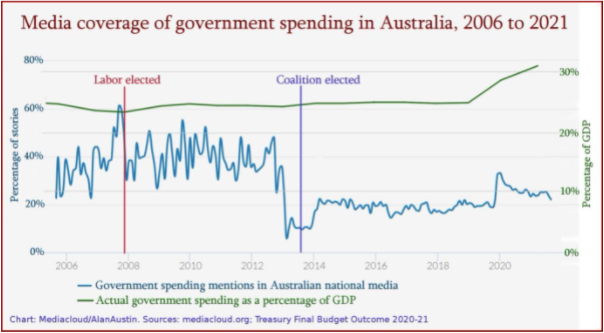
The bright young boffins at mediacloud.org measure how often the mainstream media use key words in their news coverage. Tracking “government spending” shows this was deployed constantly during the Labor years — usually expressing alarm and dismay — but less so after the change of government in 2013.

As the chart shows, use of the term did not correlate with actual spending. Even when government payments hit an all-time high of 27.7% of GDP in 2020, this did not excite economics reporters much. Even less so, it seems from the graph, in 2021 when a fresh record high of 31.6% was reached.
The pandemic and the GFC
Of course, Coalition defenders will argue the pandemic necessitated all that spending. Maybe. But the FBO shows that Australia got through the global financial crisis spending only 25.9% of GDP in 2009-10, the year of world-leading stimulus expenditure.
We can see now that while the billions spent in 2009 and 2010 seemed eye-watering then, Australia’s GDP grew strongly through productivity increases, retention of export revenue, steady wage rises, vast infrastructure development and minimum waste.
In contrast, this time around productivity is stagnant, export profits are largely untaxed, wages have flatlined, infrastructure investment is at an all-time low and waste is in the multiple tens of billions.
GDP has contracted in three out of the past seven quarters, with the September number just 0.2% higher than the figure posted two years ago.
Highest-taxing governments
Tax data shows the media has used this topic effectively to damn Labor, despite its consistent superiority. Again, as this graph shows, there was frenzied gloom-and-doom coverage of taxation through the Labor years, but far fewer mentions as the tax burden rose steadily thereafter.

The FBO (Table B3) shows the lowest-taxing government since records began in 1970 was again Whitlam’s, with just 18.3% of GDP collected annually on average. Malcolm Fraser’s came next with 20.8%, then Kevin Rudd/Julia Gillards’ with 21.2%.
The level was 23.3% when Rudd took charge in 2007. It then fell steadily to 19.9% in 2010-11, the lowest level since the 1970s. The next lowest taxing period was under Bob Hawke and Paul Keating, with 21.8% of GDP taken each year.
The highest-taxing administration by a huge margin was the Howard government. It took the level from 21.9% in the year it won office, 1996, up to 24.3% in 2005 and 2006. The average tax take over its tenure was 23.4%.
The second worse period was the Coalition since 2013, which has increased the impost substantially every year except 2019-20. From 21.3% when the Coalition defeated Labor, it rose steadily, hitting 23.0% in 2019. The average impost since Morrison has been PM is 22.5% of GDP.
Is it possible facts might enter the media discussion on taxing and spending in this election campaign? We shall see.


It is brilliant that Crikey can find these analytical ppl to torpedo the Coalition at the scare campaign that they set out to foister on otherwise unsuspecting people.
If you dig deeper you will find just how deep this money pit is within the Coalition, all the back hand deals, jobs for mates or failed politicians they parachute there cohorrs into plum rolls and say it is in our best interests.
So many foot in mouth scenarios are set in place each time this rabble, circus of clowns opens it’s mouth it never looks in the rear vuew mirror to see how the past catches up with it and the lies!
Just another plank in the MSM’s decades long propaganda/misinformation/re-education campaign to build a fact-proof, anti-Labor Australia.
Facts! who would have thought facts mattered?
Certainly, it seems journalists, especially mainstream media, and right wing commentators, do not bother with facts, and neither, but with no surprise at all, do politicians on the Right of politics.
It all suits the message they want to drive home, despite facts to the contrary, that it is Labor who are the big spenders and big Taxers.
This article compares the financial facts about Government spending and taxing, over many decades, with the intensity of media reporting about the spending and taxing.
VERY interesting reading.
Even though there are a surprising number of people in the population who are not swayed by facts, I think it is still worth continuing to present the facts.
Who knows, the surprise about seeing these facts may lead to them: stopping, reflecting and applying ‘critical thinking’.
Wonders may never cease!
Australia has not had a pluralist media for years but especially nowadays, a ‘medium’ which is used to bombard the above media age cohort with anti-Labor agitprop which implicitly promotes the LNP as competent, by using PR techniques, not news gathering.
Politics in Australia, in which the mainstream media is a participant, is about keeping the Australian Labor Party out of office.
This article is an illustration of one of the more effective mechanisms for doing that.
On a different subject where the media does the LNP’s bidding, an article discussing climate policy on The Age site mentioned that the LNP policy was for a 35% reduction in greenhouse gases by 2030 compared to 2005.
That is not the case. The LNP’s policy is for 26-28%, they just say that Australia is going to exceed that target and get to 35% (whetehr that includes dodgy carryover credits, I do not know).