Today’s Nielsen via Fairfax stable comes primaries running 42 (steady)/ 41 (up 4) to Labor, washing out into a two party preferred of 54/46 the same way – a 2 point gain to the Coalition since the last Nielsen poll in November. The Greens are on 10 (down 3) while the broad ‘Others’ are on 8 (down 1). This comes from a sample of 1400, giving us an MoE that maxes out around the 2.6% mark. The complete demographic tables for the poll can be seen here.
Nielsen is the last of the regular pollsters returning to the field this year, with all of them now having shown an increase in Coalition support under Abbott’s ascension to the leadership.
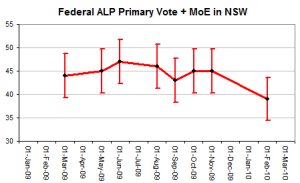
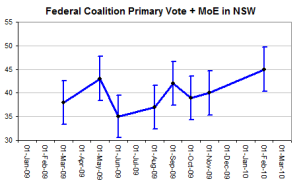
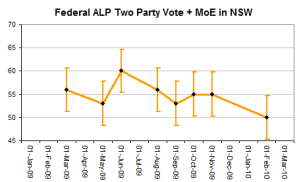
There was talk in the press today about the movement in some of the geographic subsamples of the Nielsen polls – specifically NSW. We need to be pretty careful about taking those State based sub-samples at face value because of the small sample sizes involved. In NSW, for instance, the sample is only around 430 – giving us margins of error between 4.5 and 4.7% for the major party primary votes and two party preferred. As a result, we expect to see a large chunk of random volatility in these sub-samples on a poll by poll basis.
To give an example of this in action, if we chart the major party primaries and two party preferred of the NSW sub-samples of the Nielsen polls and also add in the margins of error, this is what we get: (click to expand)
Just note that there were actually two Nielsens in November – I just knocked one out so the charts didn’t get cluttered up.
As you can see, the pure sampling error bands on these sub samples are pretty substantial, so just be wary of drawing too many conclusions from the state level data that you can find in the tables.
Nielsen also ran additional questions in this poll on the climate change policies and means testing the private health insurance rebate. I’ve got the full cross-tabs for those which I’m running through now and they’re particularly interesting – so there’ll be a specific post about the additional questions a little later on today.
UPDATE:
Nielsen Part 2 is now up.
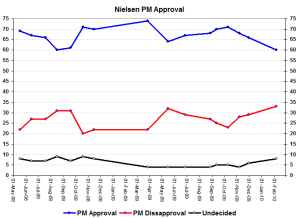
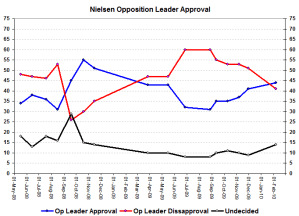
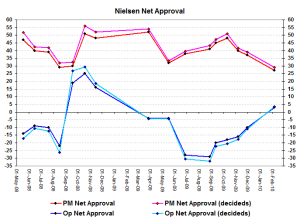
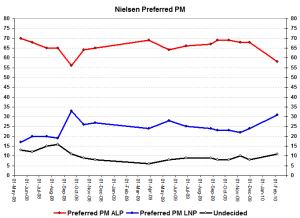
Meanwhile, the usual Nielsen charts come in like this – just note Abbott’s relatively low net approval ratings for a new leader, it’s rather unusual.



Crikey is committed to hosting lively discussions. Help us keep the conversation useful, interesting and welcoming. We aim to publish comments quickly in the interest of promoting robust conversation, but we’re a small team and we deploy filters to protect against legal risk. Occasionally your comment may be held up while we review, but we’re working as fast as we can to keep the conversation rolling.
The Crikey comment section is members-only content. Please subscribe to leave a comment.
The Crikey comment section is members-only content. Please login to leave a comment.