This week’s Essential Report comes in with the primaries running 43 (up 1)/ 40 (steady) to Labor, washing out into a two party preferred of 54/46 the same way – a one point gain to Labor since last week. The Greens and the broad “Others” are steady on 9 a piece. This comes from a rolling two week sample of 1889, giving us an MoE that maxes out around the 2.3% mark.
Additional questions this week covered which level of government the public believes should be responsible for an array of issues, perceptions of gender wage differentials in the workplace, why people vote the way they do at both State and Fed elections, as well as public opinion on Rudd’s national curriculum.
These additional questions ran off a sample of 1129, giving us an MoE that maxes out around the 2.9% mark.
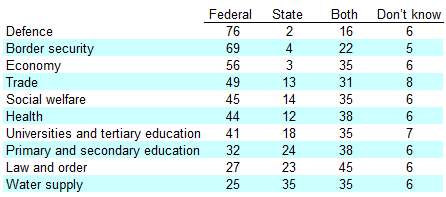
Do you think the following services should be mainly the responsibility of the Federal Government or State Governments?
On the cross-tabs we have:
People in Western Australia (50%) and Victoria (43%) wee more likely to think that health should be the responsibility of both State and Federal Governments.
35% of those surveyed think that water supply should be the responsibility of the State Governments and 25% think it should be the
responsibility of the Federal Government.People in South Australia (42%) were more likely to think that water supply should be the responsibility of the Federal Government.
If we ever wonder why Federal governments have centralist tendencies, we should probably look in the mirror occasionally. I suppose, as a consolation, we think States should do water 😀
.
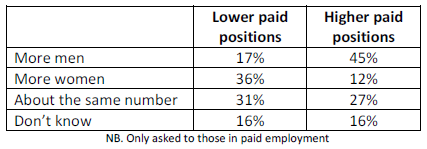
In your workplace, are there more men or more women in the lower paid positions?
In your workplace, are there more men or more women in the higher paid positions?
On the cross-tabs we have:
49% of women indicated that there are more women in lower paid positions in their workplace.
44% of those in part-time work indicated that there are more women than men in lower paid positions in their workplace.
.
Did you know that the average national weekly ordinary-hours earnings across all industries for men is more than 20% higher than for women?
On the cross-tabs, we have:
Women were more likely to know that average earnings for men is more than 20% higher than for women (55%), while men were more likely to not know (52%).
People aged 55 years and over were more likely to know (74%), while those aged 18 – 24 were more likely to not know earnings are higher for men than women (63%).
.
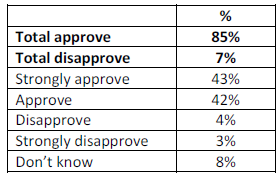
The Rudd Government proposes to introduce a national curriculum from next year where every student from prep to year 10 will learn from the same curriculum in English, maths, history and science. Do you approve or disapprove of the Government’s proposal for a national curriculum?
On the cross-tabs we have:
Labor voters were slightly more likely than Coalition and Green voters to approve (90% Labor v 86% Coalition, 85% Green).
Approval was high amongst all demographic groups.
While this result looks extraordinarily high at first glance, we are dealing with a population that has – as other questions in the poll suggest – massive centralist government tendencies. Keeping that in mind, this result probably isn’t that surprising. If the Coalition starts campaigning against it, natural partisan interest will come to the fore where some Coalition voters change their view because that’s what their party says they should do – so that would reduce the size of majority a bit. But these politically virginal results, relatively untainted by partisan argy bargy as tey are, make for a rather interesting result none the less.
.
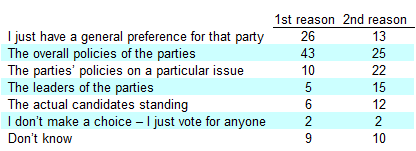
When you vote in Federal or State elections, which of the following best describes how you decide who to vote for?
On the cross-tabs we have:
48% of Coalition voters and 42% of Labor voters indicated that it is the overall policies of the parties that determine how they vote in a Federal or State election.
35% of Labor voters and 31% of Coalition voters indicated that having a general preference for a party is the primary reason that best describes how they vote in a Federal or State election.
People aged 65 years and over were more likely to indicate it is party policy that primarily determine how they vote in a Federal or State election (57%), while those aged 35 – 44 were more likely were more likely to indicate it is a general preference for a party that determines how they will vote (32%).
The top two responses can probably be thrown in the same bag – giving us 69% that vote on the vibe. The 2% that don’t make a choice but just vote for anyone are, I suppose, at least honest (shakes head).


Crikey is committed to hosting lively discussions. Help us keep the conversation useful, interesting and welcoming. We aim to publish comments quickly in the interest of promoting robust conversation, but we’re a small team and we deploy filters to protect against legal risk. Occasionally your comment may be held up while we review, but we’re working as fast as we can to keep the conversation rolling.
The Crikey comment section is members-only content. Please subscribe to leave a comment.
The Crikey comment section is members-only content. Please login to leave a comment.