Over the last 30 years or so, probably longer, the size and distribution of the informal vote that we see at every election can be largely explained by a handful of variables — with the election on Saturday being no exception.
The first of these variables is ballot length — the number of candidates we see standing in each electorate. The mechanics of this one are fairly obvious, where a given voter is more likely to make a mistake filling out the ballot when there are say, 13 candidates on the ballot paper then they would if there were only, say, three candidates on the ballot paper. The more candidates there are on the ballot, the more human input there has to be to fill in the ballot, meaning the number of mistakes increases. On Saturday’s election, the number of candidates on ballots ranged from a lowly three through to a high of 11.
The next variable is a language and communications one — the proportion of each electorate that speaks English poorly or not at all. The mechanics of this one are fairly obvious as well, where folks that may struggle to understand the instructions for filling out the ballot because of language barriers, generally tend to make more mistakes, deeming the ballot paper informal. The proportion of the electorate that speaks English poorly or not at all ranges from a low of 0.1% in the seat of Bendigo in Victoria through to a high of 15.9% in the seat of Fowler in NSW.
The third variable is a political systems variable — Optional Preferential Voting operating for state government elections. What we see happen here is that voters in states like NSW and Qld which have optional preferential voting at the state level, (too) regularly mark their ballots in the Federal election as if optional preferential voting was also applying there. So we witness relatively large numbers of ballot papers in NSW and Qld with just a “1” placed next to a candidate and no further preferences marked on the paper, deeming the ballot informal.
If we use the AEC data at the seat level, we can get candidate numbers and the size of the informal vote for each electorate, while census data can tell us the proportion of each electorate that speaks English poorly or not at well. On the optional preferential voting variable, we can use a dummy variable to denote electorates in states that have OPV operating at the state level (NSW and Qld). With this data, we can do a bit of regression work to explore it.
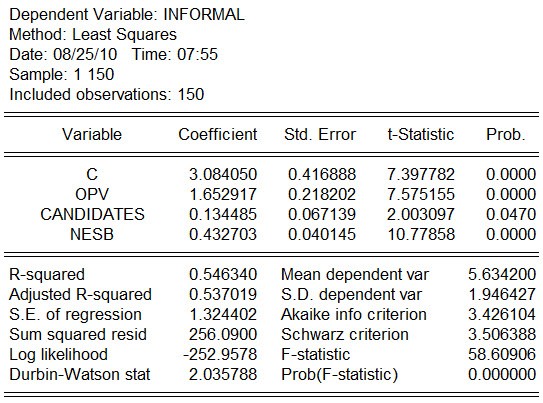
What we do is regress the informal vote against the other three variables to see how much each variable affects the size of the informal vote. For the stats types, the stats output comes in like this:

For the non-stats types, the stuff above looks much more complicated than it actually is. This is what the results actually mean:

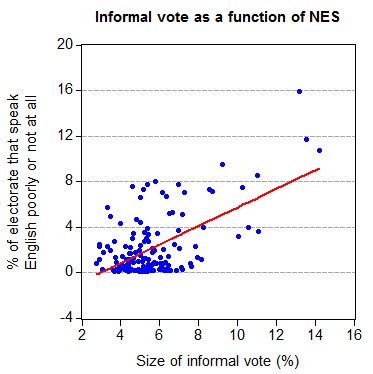
ES (non-english speaking background) is the census estimate of the proportion of the electorate that speaks English poorly or not at all. The regression results tell us that for every 1% increase in that proportion of people in a given electorate that speak English poorly or not at all, the average increase in the size of the informal vote in that given electorate is 0.43%. So a 10% increase in the proportion speaking English poorly or not at all would lead, on average, to an increase in the informal vote of 4.3%. It’s a fairly powerful relationship, which we can see by running a simple scatter plot for all 150 electorates:

The Candidate Number results tell us that for every additional candidate on the ballot paper, the size of the informal vote jumps by over 1 tenth of a percent — so having five more candidates would increase, on average, the size of the informal vote by 0.65%, or well over half a percent.
Finally, if a state had optional preferential voting operating at the state government level, the size of the informal vote in those states (holding other variables constant) is, on average, 1.65 — meaning that electorates in those states have an informal vote 1.65% higher on average than electorates on states without OPV operating at the state government level.
These variables are all statistically significant and together explain around 54% of the variation we saw in the informal vote on Saturday.
Finally, the “C” in the stats output is the Constant — telling us what the average level of informal vote would be were these other 3 variables all theoretically zero, in that OPV didn’t operate, everyone spoke English well and there were no candidates on the ballot. Some of that might sound a bit silly, but the Constant gives us an idea of the generic level of informal vote that cannot be explained by the three variables.
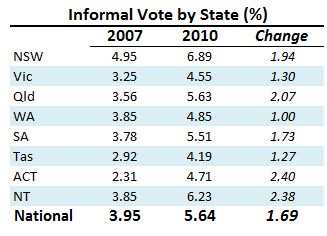
It’s also worth looking at how the informal has changed since the last election. First up, the broad changes in state and national averages :

The informal vote everywhere went up, with the ACT leading the way with a 2.4% increase while WA showed the smallest increase of exactly 1%. More interesting though is if we compare the regression results above with the same regression undertaken on the 2007 results.


So it would be fair to say the “jump”, in this election, has been from a minimum “26%” in WA, to more than doubled (“103%” increase) for Canberra?
With a national average increase in the Informal vote of “42.78”% – and not all votes counted – on 2007’s figures?
I w as hoping for a discussion of the dozen or more seats with the highest informal vote. They all came from NSW. A cursory comparison of this election’s return Vs the last election, in 2007, indicates that the same people, under the same circumstances (thus one does not need to consider NES or OPV factors) have increased their informal vote significantly.
Adjustment for the number of candidates might explain, say, a 26% increase in informals if the candidate number this time was 2.0 above 2007… Poss can do the numbersw better than I.
These people have demonstrated in 2007 that they can deliver more formal votes, but have chosen in 2010 not to do so.
The thing which statistics will not demonstrate is the reason for these individual decisions not to record a formal vote. I suggest:
“A pox on all your houses.”
“Don’t want Lib, Don’t want Labour, Don’t know the others.”
The Latham factor.
A handle on this last might be possible by comparison of the OPV type votes with numbering stopping before a valid vote had been achieved, or just numbering one box. I expect that this number will be hard to determine directly because the AEC does not count these separately.
Your commentator – as so many journalists have during this campaign – is completely missing the point. People are CHOOSING to vote informally as John Bennetts points out – ‘a pox on all your houses.’ Many vote informally in the Lower house because, for example, there is no point voting Green there and a vote will go to Labor – which is NOT what we want. Yet another example of the commentariat being completely out of touch.