The release on Tuesday of the Gillard government’s breakdown of the 500 firms forced to pay up under the carbon tax seemed — on the surface — reasonably comprehensive.
Climate Change Minister Greg Combet informed the nation that power stations, mines and heavy industry would be forced to cough up, as would a range of state government authorities. A total of 135 operated in NSW or the ACT, 110 were in Queensland, 85 in Victoria, 75 in Western Australia, 25 in South Australia, 20 in Tasmania and “fewer than 10” in the Northern Territory. A further 45 were interstate operations.
But who are they? Combet declined to name and shame the perpetrators, suggesting instead that their public airing breached a “confidentiality” provision of the Howard-era National Greenhouse and Energy Reporting Act. Which firms, reporters begged to know, are in the prime minister’s sights?
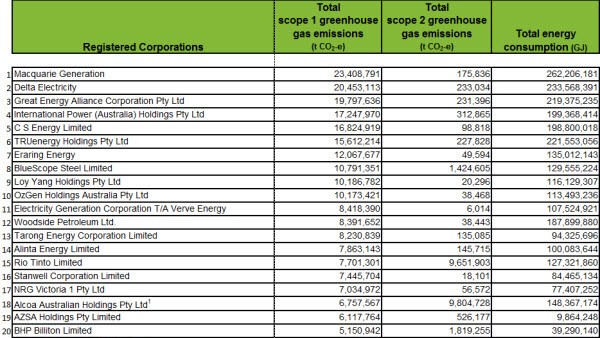
A quick check of the last available public data under the NGER Act provides a reasonable clue. This list, published earlier this year and based on emissions from 2009-10, details the 300 companies that emitted over 87,500 tonnes of CO2 equivalent — both on their own sites and through secondary power and energy consumption. It reads like a who’s who of Australia’s top corporates poised to write out fat cheques to the government.
Unsurprisingly, Macquarie Generation tops the list at a massive 23.4 million tonnes emitted on its own premises, with Delta Electricity coming in next at 20.4 million. Steelmakers like Bluescope — which will receive $180 million in compensation — are on the next tier, followed by the big miners BHP Billiton, Rio Tinto and Anglo American at around 5 to 7 million. Qantas — which has said it will hike fares to soak up its liability — and Virgin Blue also get a guernsey at 4 million and 1.7 million tonnes respectively.
Keen readers will have noticed there are only 234 companies on the list that exceed the carbon tax’s 25,000 tonne limit for own-premises emissions. For some of them, emissions may have increased over the last year. So where are the additional 266 firms alluded to by Combet that round out the 500?
The NGER list is limited in two respects.
Under the carbon tax, we know companies that produce over 25,000 tonnes of emissions a year off their own bat must stump up $23 a tonne — which works out to a minimum of $575,000 before free permits and compensation. But there is an important caveat — the company must produce over 25,000 tonnes per site, which means those that exceed the 25k benchmark but whose operations are spread around the city or country will escape scrutiny.
A number of those on the NGER — like Mars, McCain and Harvey Norman — would probably be exempt because they operate multiple factories and stores.
Secondly, the list is divided into “Scope 1” and “Scope 2” emissions. Scope 1 relates to in house emissions while Scope 2 relates to energy used on site, but generated elsewhere.
Under the carbon tax, only Scope 1 emissions are considered. But the 2009-10 NGER list includes companies that produce more than 87,500 tonnes of emissions in total — regardless of whether they’re incurred under Scope 1 or Scope 2. Therefore, there would be numerous — perhaps 50 or so — firms that exceed the carbon tax threshold but do not trigger the 87.5k total required for inclusion on the list.
A further hint to the identities of the missing 266 can be found in this line from Combet’s release: “The remaining 190 operate in the waste disposal sector.” Tellingly, the NGER list is suspiciously free of landfill, garbage and recycling firms, aside from behemoths like Transpacific Industries. The remainder would seem to be council tips which fall under the umbrella of local government.
In well under 12 months, and assuming those firms don’t out themselves in the meantime or get fingered by the government, the public will finally have a better picture. The 2010-11 version of the NGER, due out next year, will ratchet down to include all companies that emit 50,000 tonnes or more — which should give a much more specific indication of the carbon tax’s scope.
In the meantime, here’s the next best thing:
Click through for the complete spreadsheet


Andrew
I suggest you take a look at the National Pollutant Inventory site.
Emissions of CO2 (except for a few methane emitters) will be very similar to those emitting large amounts of NOx, SOx, and CO – They are all products of combustion.
It will be a bit tedious to waste through all the reports but the information is there
hi daretoread,
Do you know why the NPI’s summary reports are 4 years behind? This is probably a stupid question, but I went to their website and could only find reports as recent as 2006-07.
Thanks for the heads up!