Playing nanny. There’s a political danger for a Foreign Minister when the first decision is made to play the game of the personal consular nanny. Forever thereafter every relative of every Australian in trouble anywhere expects the same kind of time-consuming intervention.
Bob Carr is learning that lesson this week as the precedent of flying to Libya to help obtain the release of a lawyer now leads to the demand that he does the same thing for an aid worker.
No longer Australia’s biggest industry moaners? There’s no doubt that the tourism industry used to take the title. A couple of years back it was one long moan about the devastation caused by the value of the Australian dollar and the havoc wrought by floods and fire. But perhaps all that will change now that the biggest complaint seems to be a shortage of workers prepared to wait on tables and wash dishes for a pittance of a wage.
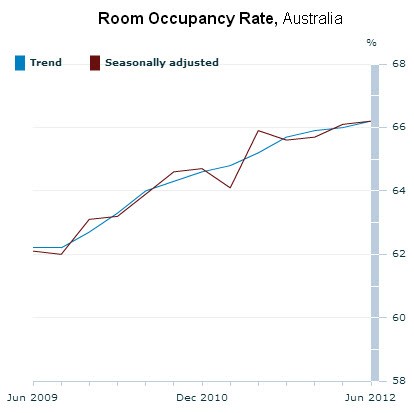
Australian Bureau of Statistics figures this morning show an industry in a healthy state.
In the June quarter 2012, the trend estimate of total accommodation takings for hotels, motels and serviced apartments with 15 or more rooms increased by 1.4% to $2247.6 million compared with the March quarter 2012.
Over the same period, the seasonally adjusted estimate increased by 0.5% to $2241.8 million.

The misleading average of the opinion polls. When faced with myriad opinion polls all showing different results, it is natural, I suppose, that people turn to an average of the findings to get a shorthand look at what is actually happening. So it is that the Real Clear Politics site with its RCP Average has gained such a following. But really, does this daily figure help or hinder an understanding of the likely voting intention of Americans at the forthcoming presidential election? On my, admittedly cursory examination, there are grounds for thinking that the RCP average is quite misleading.
The reason is simple. Not all pollsters use the same methods. Some are thorough and others are slipshod. They use a range of different measures to weight the findings from their actual interviews to try and make their published figure representative of people likely to vote. As the reliable British site UK Polling Report stresses, “by averaging quality polls will ropey ones you don’t get better figures, you just make the better ones worse”.
And the evidence suggests that there are some “ropey” polls in the Real Clear Politics sample that distort the result.
Take Rasmussen for a start. Surely its results should not be taken seriously by anyone.
Some evidence.
Since the beginning of April (I have chosen that starting date because it is when Gallup began running an Obama versus Romney question) the average result of all polls in the RCP sample puts Obama at 47.2% and Romney at 44.6% — a difference of 2.6 percentage points. Yet the average of the Rasmussen figures produces figures of Obama 45.6% and Romney 45.8%. An Obama win of 2.6 has become an Obama loss by 0.2!
Gallup also has tended to give an Obama figure lower than the total RCP average: Obama 46.4% to Romney’s 45.7% – a difference of just 0.7 points..
Yet Gallup is one of the most respected pollsters in the country. Is this just one of those statistical aberrations that can happen or is there a reason? I have noticed on one blog site the suggestion that Gallup assumes low African-American turnout based on 2010 when others base on 2008 or allow the sample to be the sample without weighting.
The RCP Polling Summary — The difference between Obama and Romney since April
All polls — Obama +2.6
All polls without Rasmussen and Gallup — Obama +3.4
Rasmussen polls — Obama -0.2
Gallup polls — Obama +0.7
Smoking on the big screen increases. There’s a new call for movies featuring smoking to be given an R rating in the Preventing Chronic Disease Journal published by the US federal Centres for Disease Control and Prevention. The call comes as a study published in the journal shows that top box office films last year showed more onscreen smoking than the prior year, reversing five years of steady progress in reducing tobacco imagery in movies.
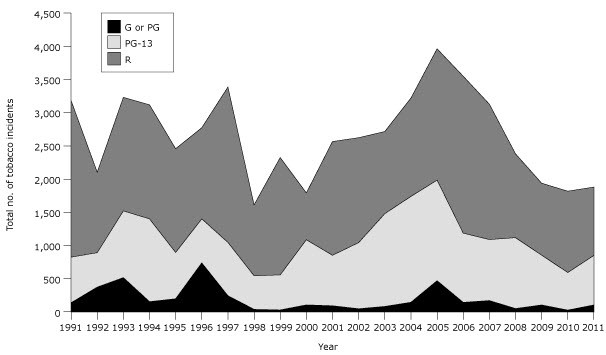
Altogether, the 134 top-grossing films of 2011 depicted nearly 1900 tobacco “incidents,” the analysis found. An incident is defined as one use or implied use (such as a lit cigarette) of a tobacco product by an actor.
Total tobacco incidents per movie rose 7% from 2010 to 2011. Among movies rated G, PG or PG-13, smoking incidents per movie soared by 36%.
The data was obtained by counting tobacco incidents in movies whose box office sales ranked in the top 10 for at least a week.
Some of the films that showed the most smoking were “period” movies, such as The Help, Midnight in Paris and Hugo, which depicted an era when smoking was more common than it is today. But others were fantasy films, including Cowboys & Aliens, Green Hornet and The Twilight Saga: Breaking Dawn — Part 1, which were aimed squarely at the youth market, noted the lead author of the study Stanton Glantz
News and views noted along the way:
- The shared language of sport and politics
- Prime ministerial trivia: sorting fact from fiction
- Have I got news for you — The Murdochs’ scandal-plagued media company has proved surprisingly resilient
- Health Benefits Of Tea: Milking It Or Not — adding milk inhibits good metabolic effects
- New Fish Species Offers Literal Take on ‘Hooking Up’


Oh Richard Farmer, who uses the Real Clear Politics (RCP) average? Hacks and fools alone. As you point out, when you pool data from varied sources on an equal basis you don’t get quality. Makes me think of the mixed entree in a bucket from ‘The Meaning of Life’, you aren’t gonna taste the pate.
If you want some quality analysis and a weighted poll average, go see Nate Silver at fivethirtyeight. It’s behind the NYT paywall, but a quick google search will give you several easy ways to cope with that…