Mining employment may have peaked while manufacturing is in surprisingly good health, some recent employment data suggests. Last week’s release of the ABS’s detailed employment data gives us a chance to see how the Australian workforce has changed over the last year, and over a longer period. It also helps bust a few myths peddled by the self-interested.
Compared to the November quarter in 2011, the economy added 112,000 jobs in trend terms (all of these numbers derive from trend data) over the four quarters to November 2012, almost exactly the same as in the comparable period in 2011, and well down on the 300,000 plus in 2010.
There were two big losers in terms of industries. Construction was one — construction employment declined 37,000 over the year to November, although it managed to add 3,000 jobs in the final quarter.
But the big loser was public administration: by the end of November, there were nearly 51,000 fewer public servants across the country than 12 months previously, compared to a growth of 40,000 the previous year. The biggest cuts were in NSW, which saw 27,000 fewer public servants, and Queensland, where 10,000 public servants lost their jobs. NSW looks to have completed its cuts: public servant numbers actually grew in the November quarter, whereas the Newman government in Queensland looks like it’s only just getting started.
The growth industries were mining, up over 28,000, although total numbers actually fell in trend terms in the November quarter, for the first time since 2009, mainly in coal and iron ore. Accommodation and food services added 26,000, professional services (one of our fastest-growing sectors) added 41,000. Australia’s biggest employer, health care and social assistance, had a comparatively quiet year, adding only 30,000 jobs, due to no growth at all in NSW and 5000 jobs being slashed from the health sector in Queensland.
And don’t be too concerned about retailing: the sector added nearly 8000 jobs, which isn’t much but in 2011 it actually lost jobs in net terms. And retailing’s problem is NSW — that’s the only state where retail employment fell significantly. Retail employment actually grew by 7% in Victoria across the year.
Most interesting is the case of manufacturing, which we are repeatedly told is in terrible strife, getting pounded by the strong dollar and in desperate need of assistance. During the year, that sector added 14,000 jobs and actually very slightly increased its share of the overall workforce, after decades of decline — it’s now around 8.4% of the Australian workforce. It’s too soon to declare the long-term decline of manufacturing over, but there’s far more to the story than what unions and manufacturing companies tell us.
Where is it growing? More traditional heavy manufacturing is in decline, yes — primary metal manufacturing shed 18,000 jobs, and fabricated metal manufacturing another 9,000. But food manufacturing — a sector that regularly demands assistance from the government on the basis of “food security” – put on 17,000 during the year.
Manufacturing is changing, rather than declining: the sector shed jobs in the traditional powerhouse of Victoria (and was flat in SA) but grew strongly in NSW, which now looks set to eclipse Victoria as the largest manufacturing state in employment terms, with 317,000 manufacturing workers to 283,000 south of the border.
But Victoria is powering ahead on professional services, with that sector growing by a remarkable 9.5% across the year, suggesting its manufacturing decline is being offset by the transition to services.
The overall trends in Australian employment, by the way, match those in the US. Healthcare and social assistance (bearing in mind there’s not a perfect correlation between US and Australian occupational categories) is nearly the largest employer in the US and is predicted to soon become the largest, despite the US having a much larger services sector that is also growing rapidly, while manufacturing is expected to continue its decline from its once-dominant role as an employer of American workers.
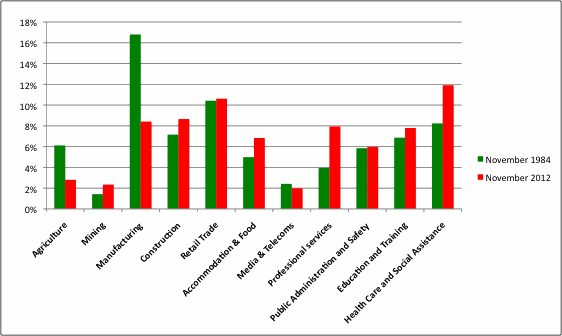
Let’s take a longer-term perspective and examine how the workforce looks at the end of 2012 compared to when the ABS first began compiling industry-level data, in the November 1984 quarter. This is how key sectors have changed as a proportion of the entire workforce over the last 28 years:
US trends suggests that by 2020, health care and professional services will continue to grow strongly as proportions of the workforce. But what if that huge collapse in manufacturing employment over the last three decades is finally over — if Australian manufacturing, in the teeth of currency-induced headwinds, has begun to turn things around?
Next year will provide us with some more evidence about its long-term prospects.


used to be so easy, to give my heart away
i found out love, was no friend of mine
playing to win, but you lose just the same
so long, it was so long ago
but i still, got the blue, for you
as the dayz come and go, there is one thing i know
that i still, got the blue, for you
It’s well worth noting that agriculture and mining sectors appear as #9 and #10 out of 11, which is somewhat at odds with the amount of special pleading and public breast-beating from their spokespersons.
Good to see the economy is transitioning not too badly. But we cannot be complacent about how things are right now though.
Don’t forget that this year we have 230,000 people requested affordable housing. 44% of them were homeless (that’s over 100,000 people), many of these homeless people are victims of domestic violence, not all of them are mentally illed which the Greens often use to answer when people question about housing availability for asylum seekers but it’s best to leave that topic for another time.
The rest of the 56% were under stressed, when losing their jobs and could not afford private housing rental. Here is where I think negative gearing has contributed to the problem, unlike those who argued that it made rent cheaper I think that it pushed prices up, and it needs to be reformed.
One other problem is public housing run by the states are very inefficient and costly. They outsource auditors to audit the conditions of the properties, these people try to put in many things to be fixed and they can for whoever they are gaining profit from, hence many unecessary quotes and cost of fixing. Another issue is they often use cheap materials, and the tenants often have to call up to get things fixed. It’ll be best if half of the workloads are assigned to their own tradies and the other half outsourced, so you can measure competitive productivity and gage durability of the materials used.
The politicians need to stop being complacent and spare some thoughts for the homeless this Christmas.
>> food manufacturing?
I hope this is more than people filling recycled jars with homemade organic jam for sale at the local produce markets to legions of tourists from the cities driving their imported SUVs.
Without any details on wages and hours worked these types of sector descriptions are worth less than a tin of leftover baked beans from New Zealand – even if it’s still half full and only opened yesterday.
What these numbers actually reveal is that the age of Peak Human is approaching faster anyone ever expected. And no one in government has a clue what people are going to do beyond changing the nappies of old people in nursing homes.
The end of the social contract as we have known it for centuries if not millenia – will make dealing with climate change a minor issue.
Peak human? Seriously?
People will do what they always do. Trade. Find a job. If they can’t find a job, they get educated. Change careers, Start their own businesses. Create new jobs. Move to new areas. Move to new countries. Things humanity has been doing for thousands of years.
As long as there is not too much of an incentive for them to do nothing (i.e pensions/unemployment benefits), the human can be extremely resourceful in its desire for a better life.
I think we’ll be fine.